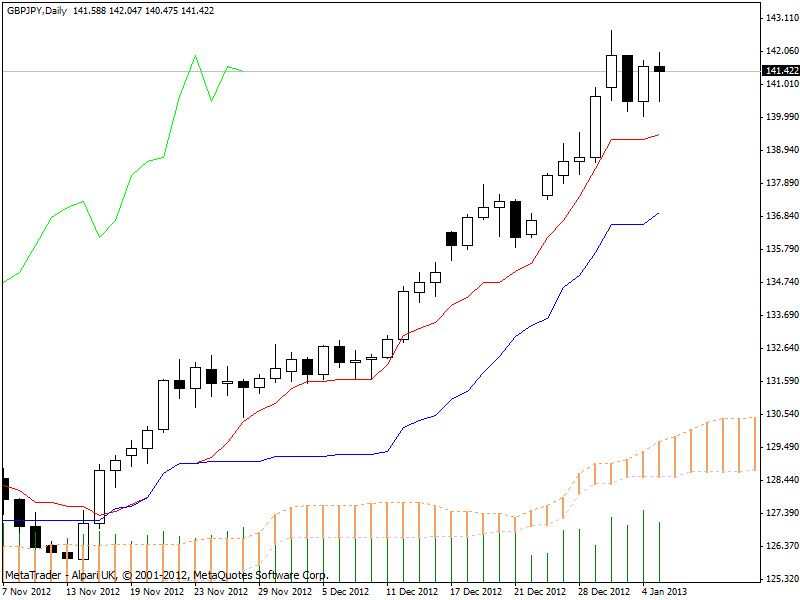
Bears started the week no stronger than they left the last as no lower lows were reached today. The candlestick did close in the hammer shape but I'm not too concerned over this as there may be some signs of further bullish development.
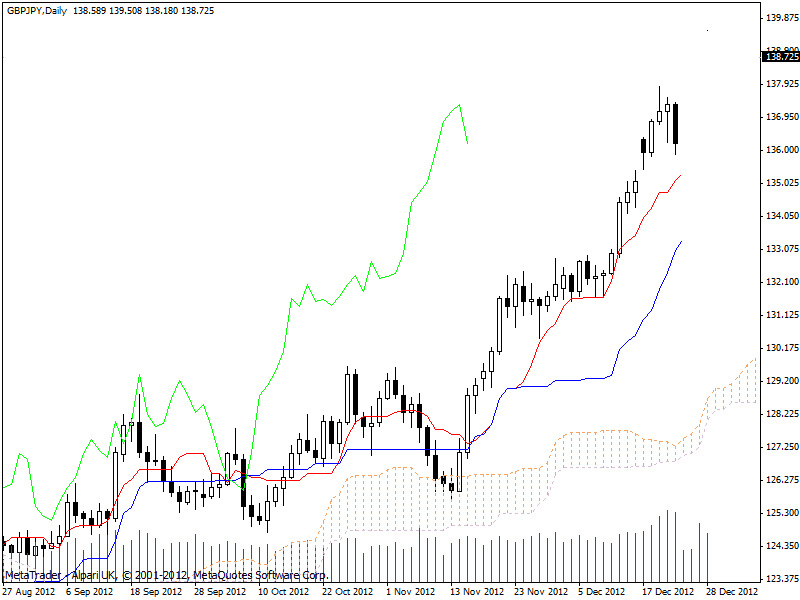
Both the tenkan sen and the kijun sen have changed from being absolutely flat to raising thier angle slightly, behaviour also imitated by sekou span A which with senkou span B flat, signals a medium bullish signal.
With no further lows, and closing at 141.441 I am still bullish on the GBP/JPY.
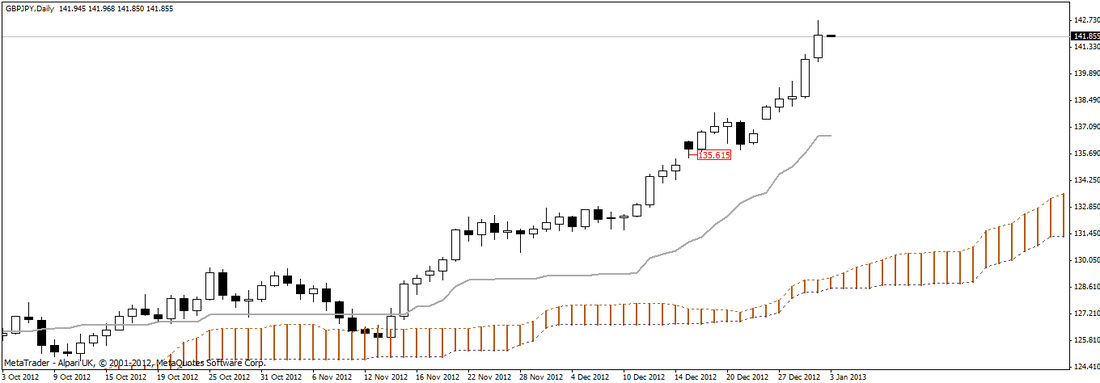
The tenkan sen closed at 139.444 and I have move my stop to this level. From a buy order on 17 December 2012 at 135.615 our trade now sits at 5,826 pips.
Thats it for today, happy trading everyone!
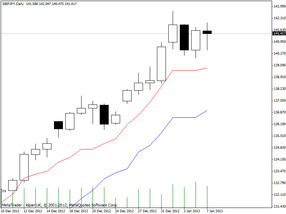
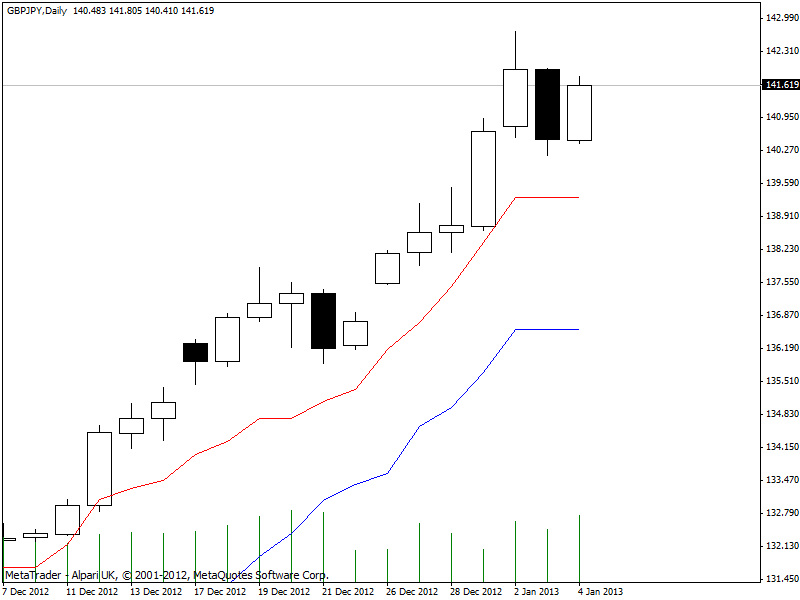
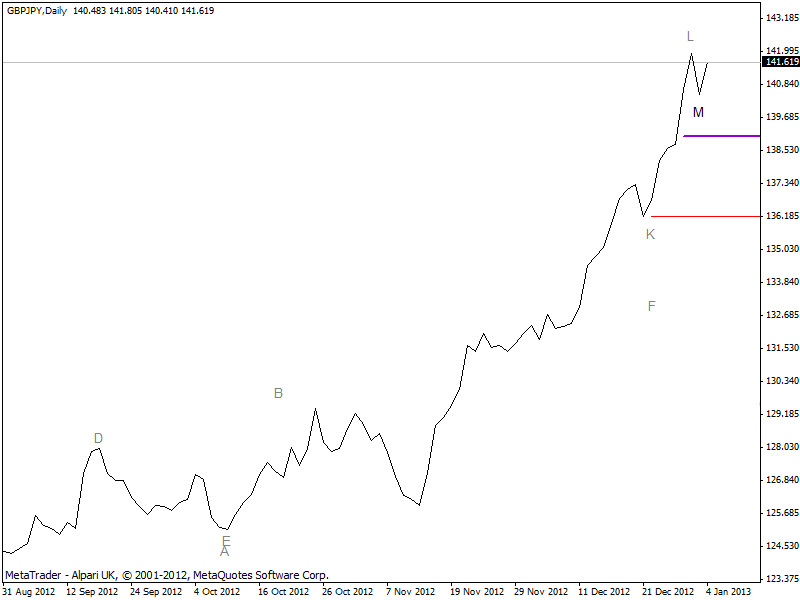
Friday saw buyers almost wipe out the gains of the previous days sellers by driving the price of the GBP/JPY from 140.494 to a high of 141.805 before settling to close for the week at 141.619.
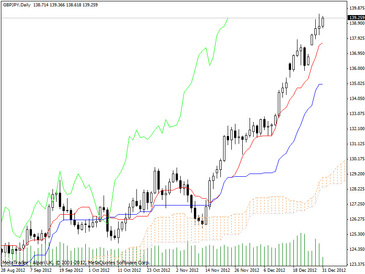
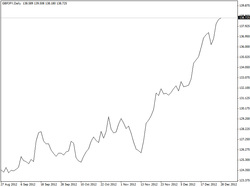
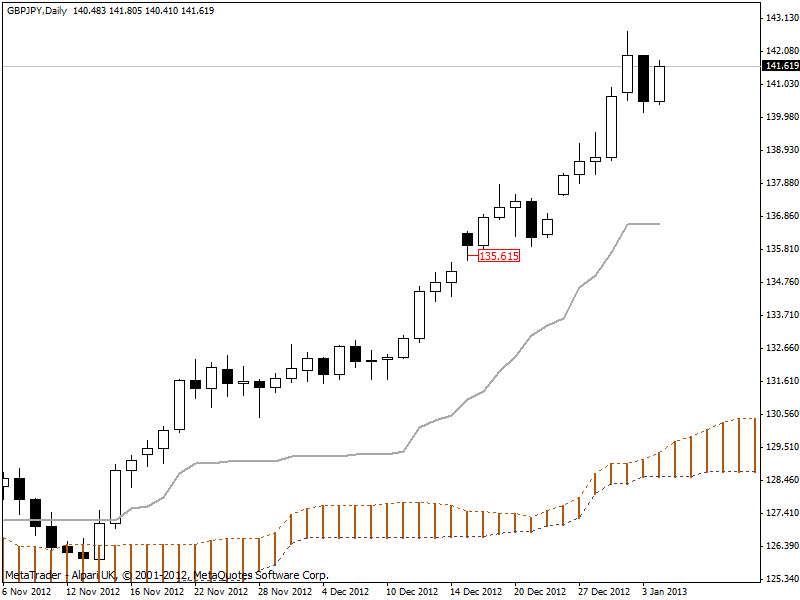
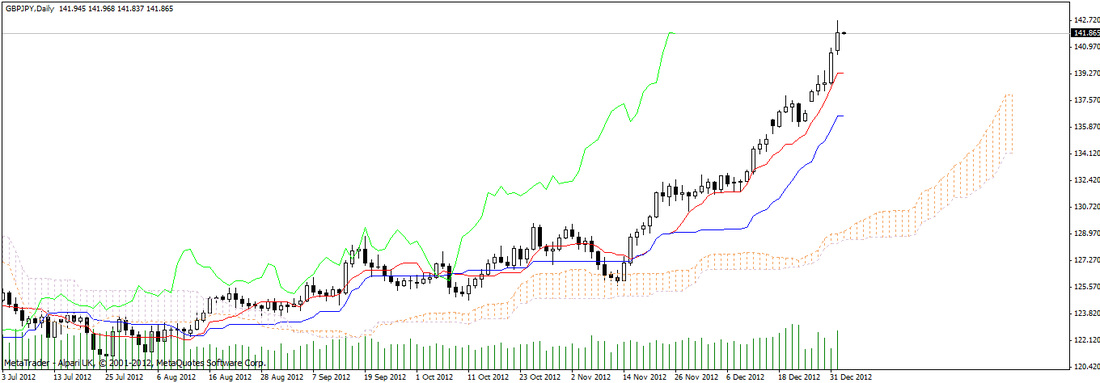
The daily and weekly charts below both continue to paint a bullish picture with the total weeks gain amounting to 2,905 pips (O:138.714, C:141.619). This move is slighty up from the previous weeks gains of 2,465 pips.
"The daily and weekly charts below both continue to paint a bullish picture"
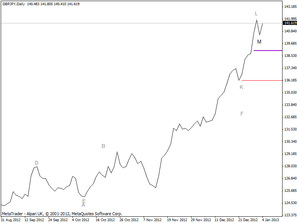
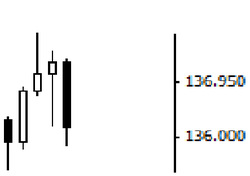
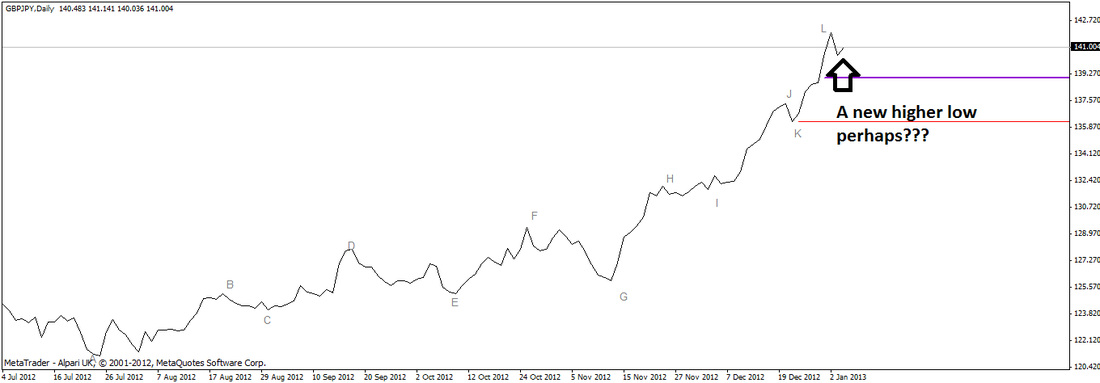
Buyers, such as I, will be happy to see a bullish close, and also the development of a higher low, marked by the bold "M" on the chart to the right. For profit protection measures I continue to hold my stop at 139.000. This is the level where I expected bears to push prices back to this week. The new higher low tells me that they have not had enough power to do this yet. If they do at all remains to bee seen and as always, I eagerly await the close of the next candle.
In the meantime I continue to be bullish on the GBP/JPY.
My current trade on this pair is, at yesterdays close, in profit to the tune of 6,004 pips from a buy order placed at 135.615 on 17 December 2012.

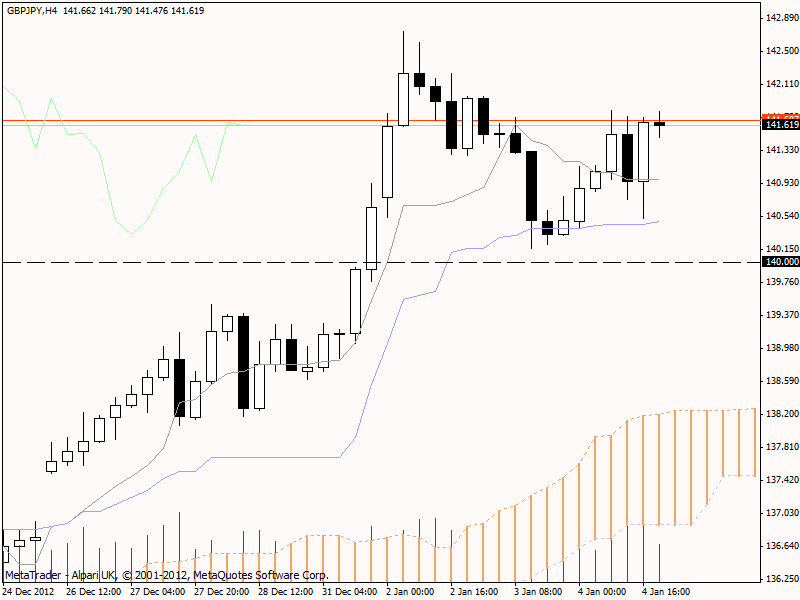
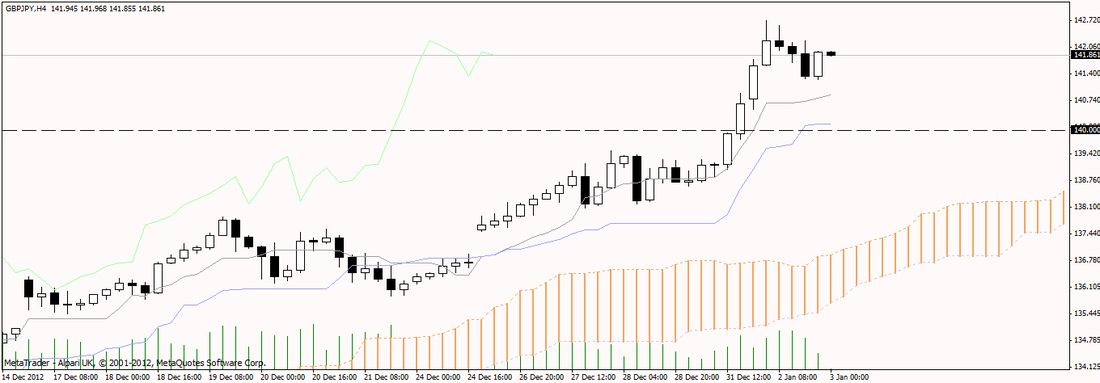
One thing I didn't do this week, and its important to comment on failings, is to regulary check my next lowest time frame.
Here on the 4H chart to the left you can see price action being rejected by the kijun sen on thursday the 3rd , this bounce was effectively another buying opportunity and my faults are:
1. I wasn't looking for it and;
2. I didn't spot it on Thursday!
REMEMBER: ALWAYS CHECK YOUR NEXT LOWEST TIME FRAMES!!!
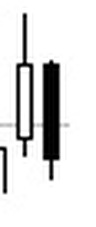
Yesterday I anticipated a bearish candle and lo and behold here we have a
bearish engulfing candle that saw a low of 140.163 before closing slightly
higher at 140.494. I also commented yesterday that I expected the pull back to
hit 139.000 at worst, and this is also where I decided to place my stop.
If fortune is in my favour, the 140.494 close will be another higher low and we will see further bullish activity, the bears have not made their mark on the charts and therefore not convinced me yet. All charts are still firmly in bullish territory but I look forward to the close of the next candle for more detail.
On a close of 140.494, I am 4,879 pips up from my buy at 135.615 and remain bullish on the GBP/JPY.

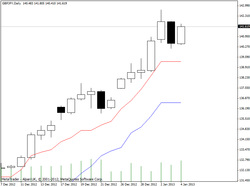
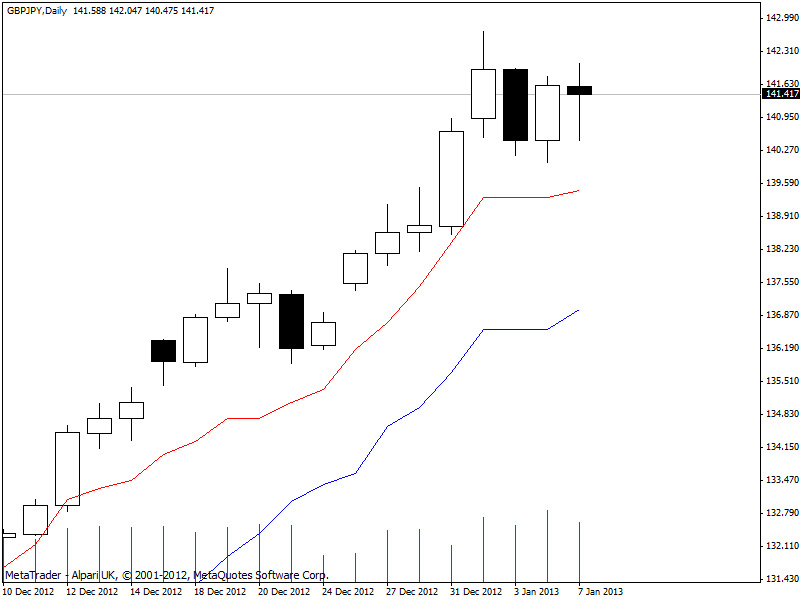
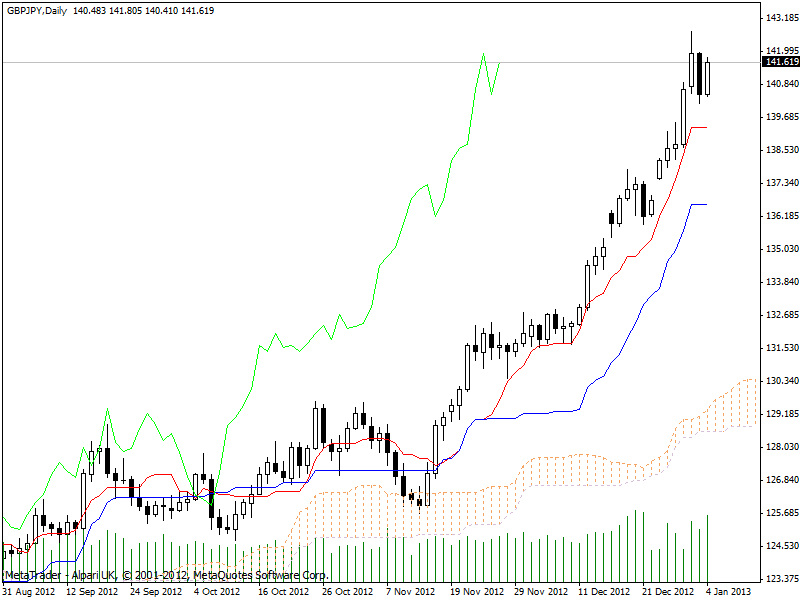
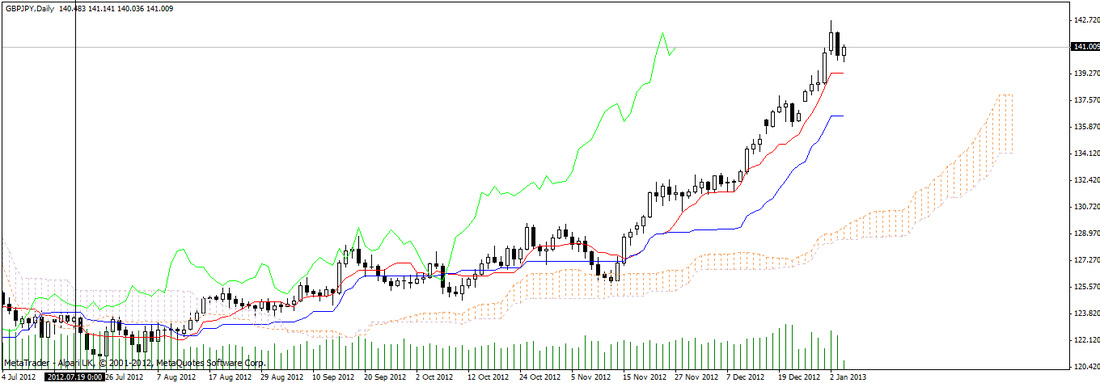
Happy New Year! In the first few days of 2013 trading the Yen continued to fall sharply against the Pound obliterating levels unchartered since 2011 and is now threatening 145.000, a level not seen since 25 April 2010.
Over the last couple of days the GBP/JPY has reached highs of 140.934 and 142.773 respectively before settling to close at 141.947.
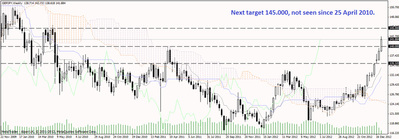
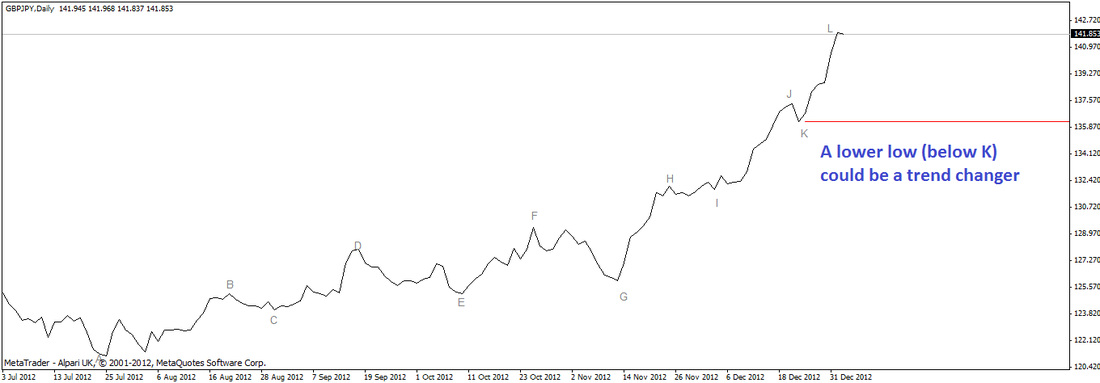
The daily ichimoku chart above, the weekly chart to the right and the four hour chart clearly show the currency pair as bullish with all signs seemingly pointing to the sky as price action is way above the kumo, comtinuing to make higher highs and higher lows as illustrated further below.
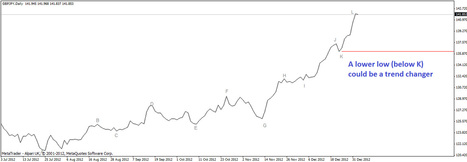
I am, of course, expecting some pull back at the worst to 139.000, and it would need bear power creating a lower low below my K marking, (approx. 136.200), tp be a trend changer for me personally.
In summary, I am still very much bullish on this pair as the uptrend is by my interpretation, intact for now. At the time of writing the pair is at 141.934. As any regular readers will know, I entered my trade at 135.615 and am therefore currently profitable to the tune of 6,319 pips. Part of me is screaming to end this trade and take profit but a trend is a trend and it was never my intention at the outset to ride the trend to the top. As we know, we can only define a top or a bottom retrospectively and this is written on a post-it note on all my screens at present to remind me of this important lesson.
That said, my stop has now moved up to 139.000 mark as of tonight to protect the majority of profits and this is no bad thing. Until next time, happy trading!
On another note, a reader requested that I implement a click to enlarge feature on all pictures I post here. This has now been done!
A mini update today as I am off on a short new years break returning the 3rd. GBP/JPY opened a bit lower at 138.714 and at the time of writing (13:00 GMT) a bullish candle is forming and the price is at 139.259, representing a gain of 3,644 pips at around 4 GBP on my 5 lots purchased.
It is worth noting that the Kijun Sen is starting to flatten out but for now I am still bullish on the GBP/JPY.
Happy trading and have a happy new year everyone!
To recap, on 17th December I entered a long trade on the GBP/JPY at 135.615. This shortened week over the xmas period saw further bullish development as anticipated:
24th December saw the pair recover and close to 136.744 leaving us with a bullish Harami pattern, denoting further upwards extention for this pair.
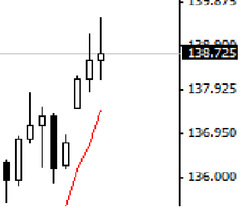
26th December saw significant gains and new highs closing at 138.159 leaving a nice bullish candle. Gains were extended futher on the 27th and 28th reaching highs of 139.508 before closing at 138.725.
The end of the week draws and I am still in profit to the tune of 3,110 pips (138.725 - 135.615) at approx 4 GBP per pip.
The candle on the 28th is almost a Doji and shows a lot of bearish pressure. Reaction and analysis in general from "the herd" (twitter, forexpros etc) is that 140.000 will present a challange and sellers are already gearing up to attempt to pick a top and make gains on the way down.
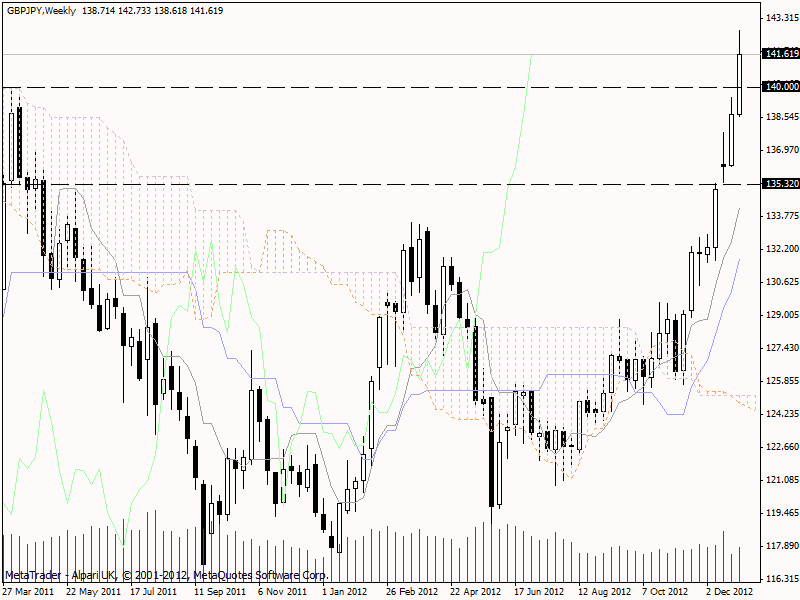
On a weekly Ichimoku chart one can see that the pair has not reached these levels since April 2011 and that the scene is clearly bullish. However, on the monthly ichimoku chart the scene is long term bearish still but a bullish tenkan-sen/kijun-sen cross has occurred as and this is generally considered to be a weak signal when occuring beneath the cloud. My (perhaps contrarian) view is that this weak signal may well be weak for the monthly time frame but perhaps not for the weekly and dailys, as is confirmed in my mind from the analysis of those particular charts. I am cautious of the 140.00 but this has been tested once before and it is often the case that a second test fairs better. Nay-sayers are quick to forecast the demise of the pound yen and I do expect to see some bearish volume over the coming week.
To protect my gains I am moving my stop to 137.500 but I remain bullish on the pair awaiting the close of the next candle.
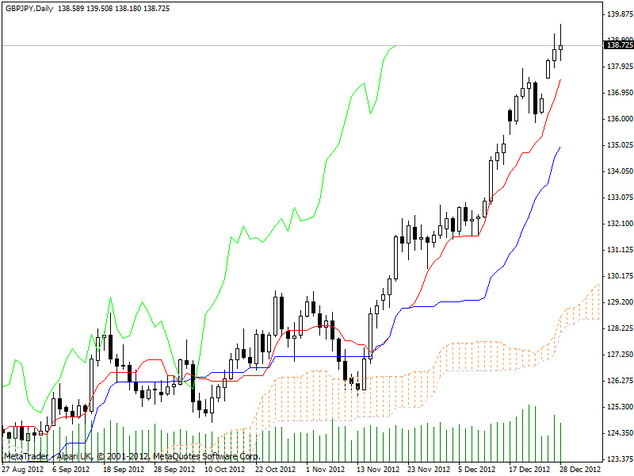
Daily Ichimoku Chart: GBP/JPY
A lot has happened since the 17th December where I went long on a bounce off the 135/6 area at 135.615 with a target view of taking profit at the 136.300 resistance.
17th December saw a bullish rise to a high of 136.770 before dipping to its close of 135.927. Although my target profit had been achieved I did not take profit but instead decided to see what the next candle would reveal. Bearing in mind the bullish picture of the daily Icimoku chart and the index analysis conducted previously I believed there could be much further on the upside, perhaps even a test of my next resistance level of 137.600.
18th December revealed a bullish engulfing pattern fueling my decision to remain in the trade. The pair hit a high of 136.913 before closing at 136.831.
19th December saw the pair reach new highs of 137.860, breaching the next level of resistance refered to above. The candle closed as a shooting star, denoting potential for reversal. Other than this one indication as all other signs are bullish, I again awaited the next candle.
20th December revealed a bearish hanging man and a low of 136.217. I considered the dow theory that a lower low would need to appear before this showed a reversal in the trend and plotted the chart below. All lows to this point have been higher lows and point to an uptrend, as does the Ichimoku chart.
21st December revealed a bearish engulfing almost bearish marabozu candle hitting a low of 135.886 before closing at 136.196. I interpret this move as a return to the trendline and not a sign of overall bearishness, remember that Ichimoku is bullish and overall the pound is doing very well against the yen.
And so the week ends with some gains wiped but in profit to the tune of 581 (136.196-135.615) at approx 4 GBP to the pip. Risk was initially 5% of captial but stop loss has been moved to break even to protect against bearish development. Happy to be in a risk free and insofar profitable trade.
My outlook remains bullish on the GBP/JPY.


 RSS Feed