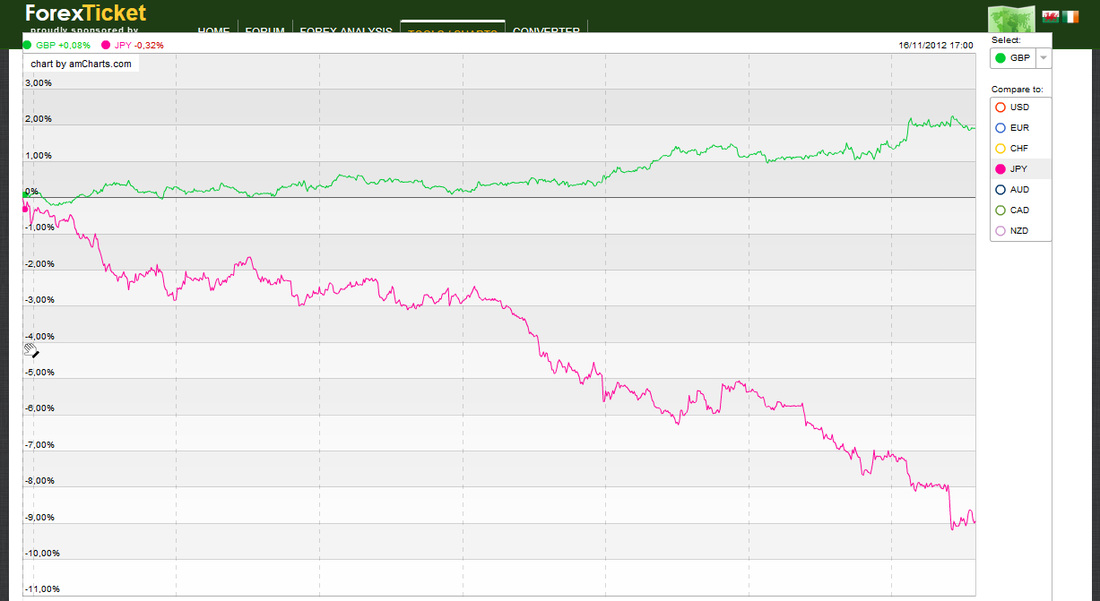
Happy New Year! In the first few days of 2013 trading the Yen continued to fall sharply against the Pound obliterating levels unchartered since 2011 and is now threatening 145.000, a level not seen since 25 April 2010.
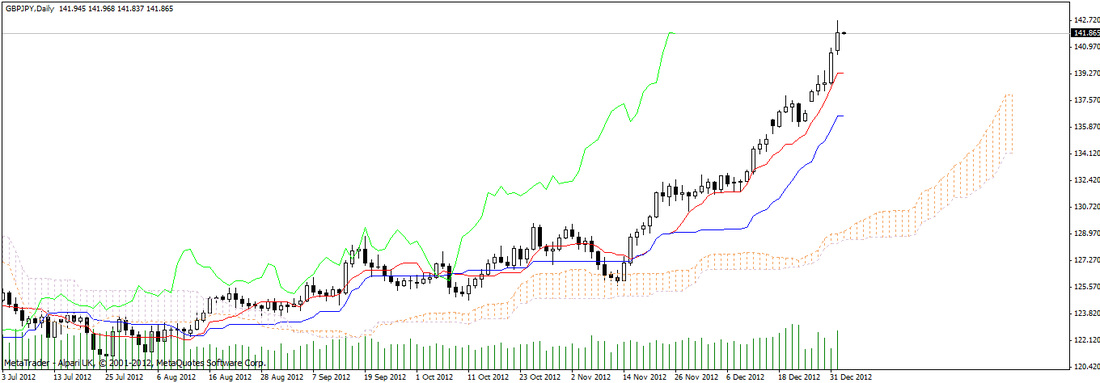
Over the last couple of days the GBP/JPY has reached highs of 140.934 and 142.773 respectively before settling to close at 141.947.
Over the last couple of days the GBP/JPY has reached highs of 140.934 and 142.773 respectively before settling to close at 141.947.
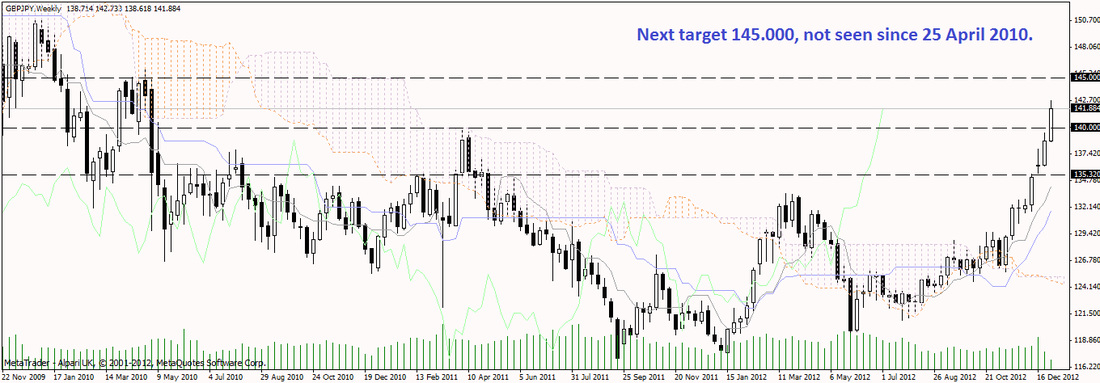
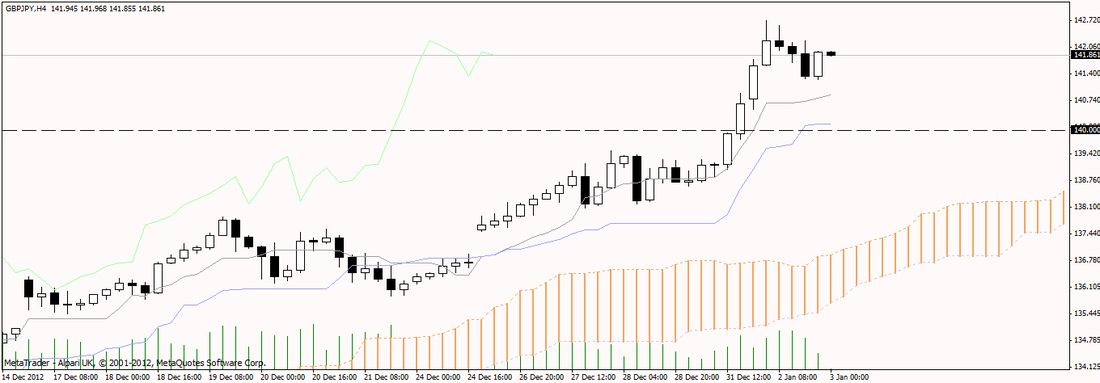
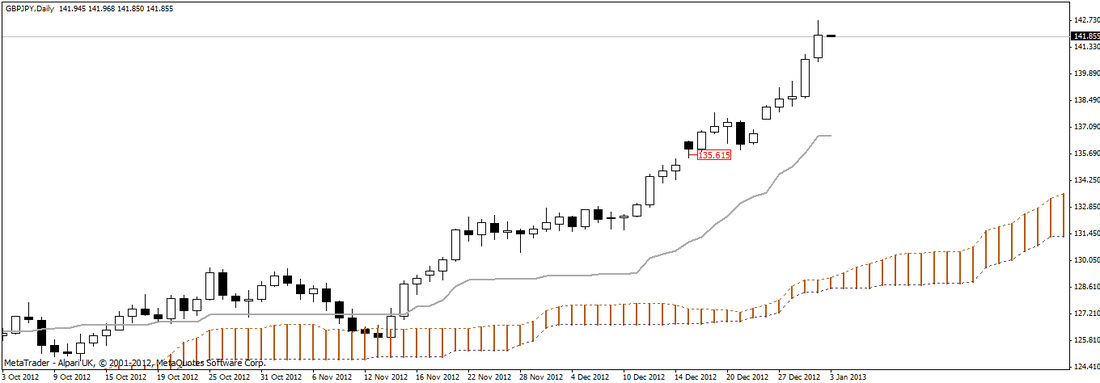
The daily ichimoku chart above, the weekly chart to the right and the four hour chart clearly show the currency pair as bullish with all signs seemingly pointing to the sky as price action is way above the kumo, comtinuing to make higher highs and higher lows as illustrated further below.
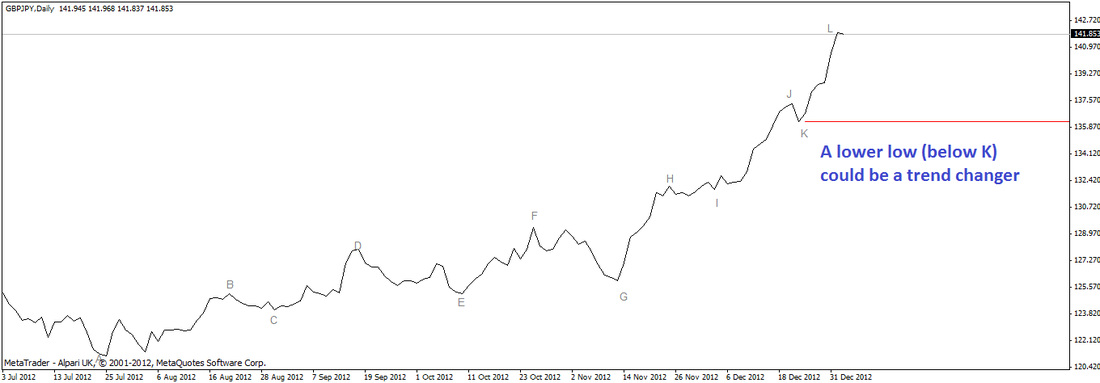
I am, of course, expecting some pull back at the worst to 139.000, and it would need bear power creating a lower low below my K marking, (approx. 136.200), tp be a trend changer for me personally.
In summary, I am still very much bullish on this pair as the uptrend is by my interpretation, intact for now. At the time of writing the pair is at 141.934. As any regular readers will know, I entered my trade at 135.615 and am therefore currently profitable to the tune of 6,319 pips. Part of me is screaming to end this trade and take profit but a trend is a trend and it was never my intention at the outset to ride the trend to the top. As we know, we can only define a top or a bottom retrospectively and this is written on a post-it note on all my screens at present to remind me of this important lesson.
That said, my stop has now moved up to 139.000 mark as of tonight to protect the majority of profits and this is no bad thing. Until next time, happy trading!
On another note, a reader requested that I implement a click to enlarge feature on all pictures I post here. This has now been done!
That said, my stop has now moved up to 139.000 mark as of tonight to protect the majority of profits and this is no bad thing. Until next time, happy trading!
On another note, a reader requested that I implement a click to enlarge feature on all pictures I post here. This has now been done!
 RSS Feed