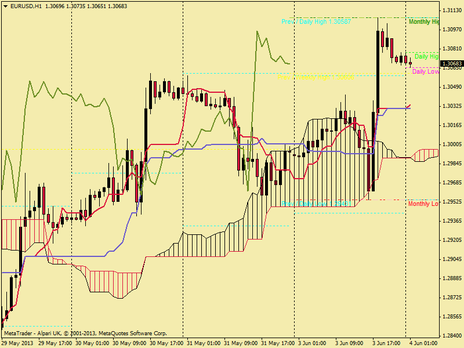
 Bullish ventures continued today with the EUR/USD hitting highs of 1.31150 testing and piercing the top of the daily cloud before being driven southward again.
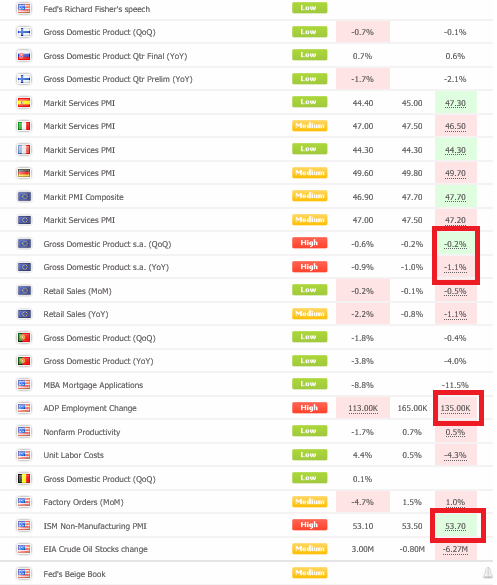
I said yesterday that I would be watching three things, and that I most certainly did. Firstly Eurozone GDP data was released. To be honest it was a bit of a mixed bag with the Quarterly figure as expected at -0.2% and the Annual slightly worse than expected at -1.1% verses -1.0%. It did drive the EUR/USD down to its daily low of 1.30922 but the data for me was too wishy washy for me to commit to a trade.
Eurozone GDP was a mixed bag, however U.S ADP Employment Change fell short of its 165k target by 30k 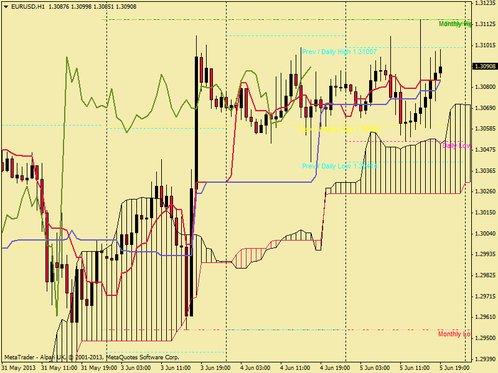 The next release was far more interesting. The Employment Change released by the Automatic Data Processing, Inc is a measure of the change in the number of employed people in the United States. Generally speaking, a rise in this indicator has positive implications for consumer spending which stimulates economic growth. Generally speaking, a high reading is seen as positive, or bullish for the USD, while a low reading is seen as negative, or bearish. The actual figure was 135,000, against an expected 165,000. I had buy stop and sell stop entry orders straddled either side of the range and thus a the buy stop was triggered at 1.30800. The movement extended the days high up to 1.31150 and this trade provided the bulk of the days profits. Next came the ISM non-manufacturing PMI data, and whilst being better than expected, this didn't stop the market from going against it to attempt another test of the highs, which is where my remaining profit was generated today. The pair seems unable to breach the 1.31 handle for long enough to extend its bullish runs up to the 1.32 handle, eyes are firmly on tomorrows European interest rate decision, policy statement and press conference as well as United States initial jobless claims and a speech by the Federal Reserve member Sarah Bloom Raskin. It could look to be a choppy day with break-outs, fake-outs and waiting around in the meantime. A lot of the data is happening all at once so tight stops and extra caution to be employed. Furthermore, a view is being generated that Fridays all important Non-Farm Payroll figures will miss expectations and thus push the EUR/USD upwards. Hit or miss, there is going to be a lot of action before the week closes. Happy Trading!
A view is being circulated that Fridays Non-Farm Payroll will fall short of expectations...
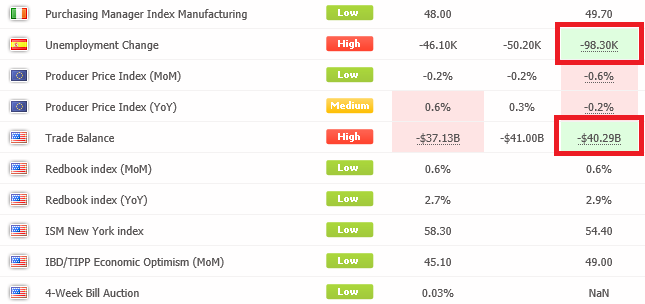
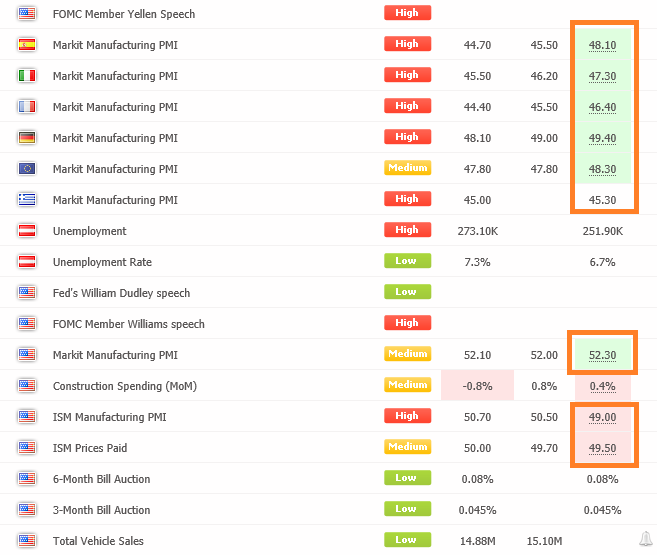
Thank you Spanish PM Mariano Rajoy! "I'm not counting chickens here, however I recommend that you pay attention to unemployment and social security numbers on Tuesday the 4th ... If the patterns we've seen are confirmed they will be clearly encouraging," - Mariano Rajoy 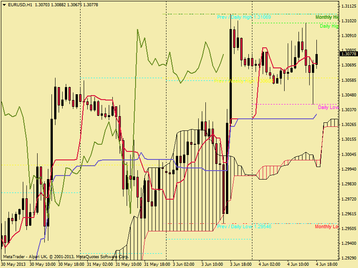 As noted above a special thank you is in order to Spanish Prime Minister Mariano Rajoy for his thick hint regarding todays employment data. There certainly was a marked drop in unemployment numbers to the tune of 98,300, which was a significant 48,100 better than the 50,200 expected.
This release moved the EUR/USD up from around 1.30500 to a high of 1.30969. In my trading I was in and out within 23 minutes of the release and beat my target of the day significantly, although part of me wishes I'd loaded up a bit more, but that would be against my money management protocols. Anyway, credit where credit is due, my trading day was made considerably shorter and highly profitable for the tip.
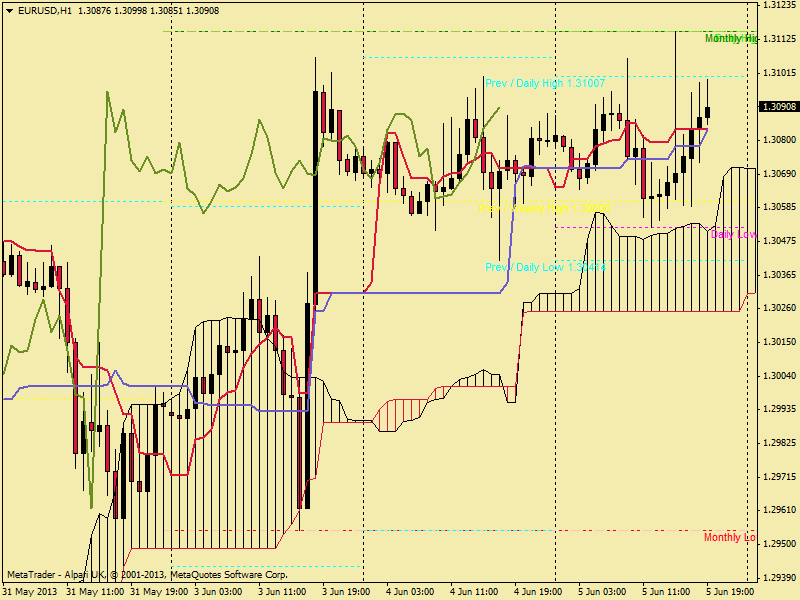
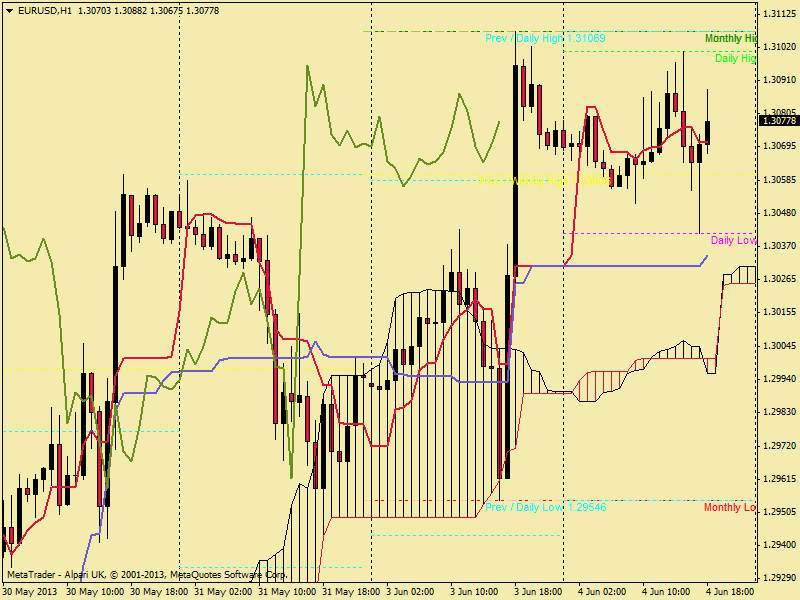
As the hourly chart shows, price failed to penetrate the 1.31 mark and fall downwards to the day low of 1.30414, no doubt aided by the stronger than expected US Trade Balance figure of -$40.29 Billion against an expected -$41.00 Billion. I did not watch or trade this event having already met my targets for the day.
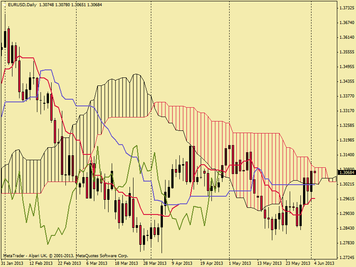
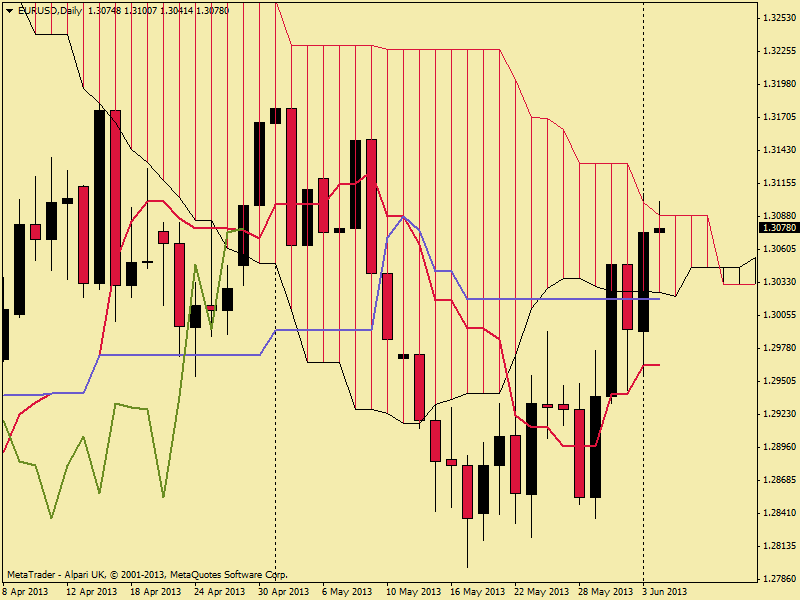
Spanish unemployment dropped by a staggering 98.3k vs an expected 50.2k.  Price at the time of writing has risen to 1.30736 and presenting a very thin bullish candle on the daily chart (right). It remains to be seen if price action can break out of the cloud and sustain, so trading caution ahead for the short term. If 1.31 proves to strong to break then price must fall below the cloud base to confirm a return to the overall bearish trend.
Tomorrow sees the release of Eurozone Gross Domestic Product data, and from the United States, Employment Change and ISM Non-Manufacturing PMI numbers. I may not be around for the Eurozone data (insert sad face here) but I fully intend to catch the US releases. Happy Trading!
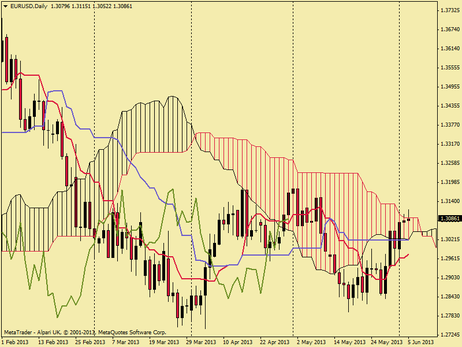
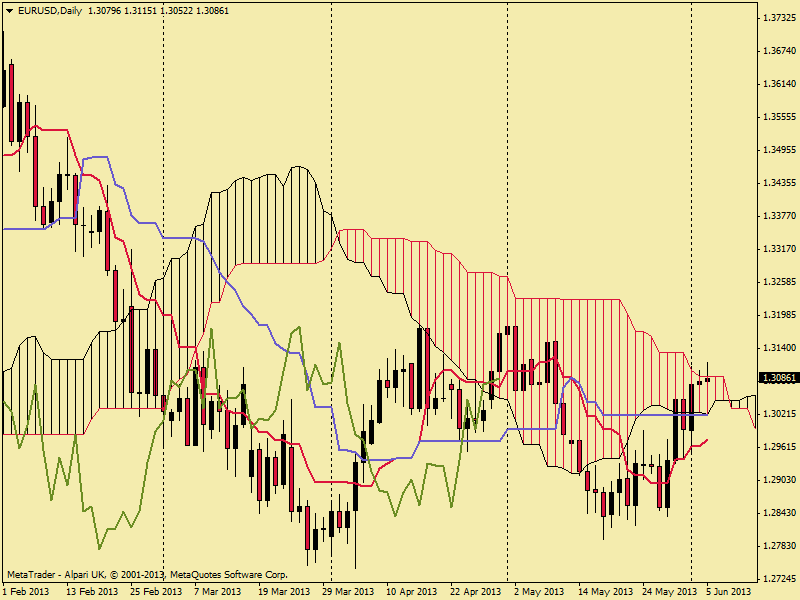
 In my last update, I was fundamentally bearish on the EUR/USD and, in the long term, I still am. In the short term however I am more cautious with this view as economic data has propelled price action into the daily cloud (figure left). A sustainable break out of the cloud could well be a game changer but personally its going to take a lot for me to drop my bias towards dollar strength.
In the first trading day of the month, price opened at 1.29925 and rose on the back of Eurozone PMI data, detailed below, to a high of 1.30427.
The good data was swiftly forgotten by the markets upon the release of US market manufacturing PMI data which was better than expected and the pair subsequently dropped beyond its opening to a low of 1.29545.
Then along came the big movement of the day. ISM Manufacturing PMI.
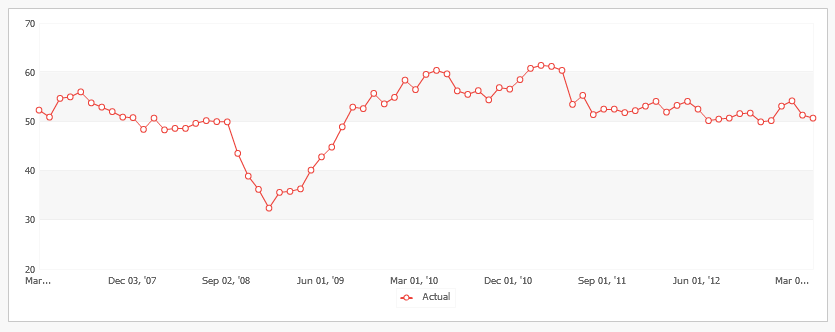
 The Institute for Supply Management (ISM) Manufacturing Index shows business conditions in the US manufacturing sector. It is a significant indicator of the overall economic condition in US. A result above 50 is seen as positive (or bullish) for the USD, whereas a result below 50 is seen as negative (or bearish). Todays result was 49 against an expect 50.50, both lesser than expected and in bearish territory. The result was a massive leap from the low of 1.29545 to a high of 1.31069. I was fortunate to have been long from a 1.29800 trigger. Below, I have included a historical ISM PMI chart which shows the significance of todays release, as the last below 50 release was December 2012 (at 49.9), and before that, August 2009, (48.9).
US ISM Manufacturing PMI result was 49 against an expected 50.50, lesser than expected and in bearish territory, a massive leap followed. 1.31069 highs. So where does this leave us? Clearly there has been an immediate bullish influence, which may well continue into the week or it might be a little over cooked and the downtrend will again resume. Tomorrow I will be very cautious in my trading using tight stops but I will be eyeing two things: 1. Spain - Unemployment Change. The monthly survey which details how many people were added during the previous month. Usually the figure is gloomy and has no impact on the Euro but this time may be an exception as Spanish PM Rajoy has released a thick hint to “watch the employment numbers on Tuesday”. 2. United States - Trade balance. The Trade Balance released by the Bureau of Economic
Analysis and the U.S. Census Bureau is a balance between exports and imports of total goods and services. A positive value shows trade surplus, while a negative value shows trade deficit. It is an event that generates some volatility for the USD. If a steady demand in exchange for US exports is seen, that would turn into a positive growth in the trade balance, and that should be positive for the USD. Happy Trading!
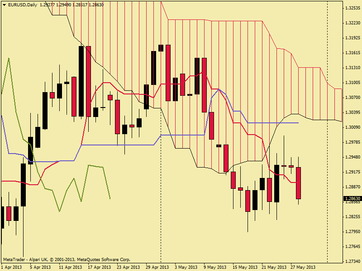 Yesterday I posted an outlook which was fundamentally bearish whilst price action remains beneath the cloud base. I also posted a perspective on the battle between dollar strength and euro recovery in as much that the clear winner would be the dollar. Todays candle (most recent in the chart to the left) was indeed very bearish largely due to a rise in US consumer confidence. The Consumer Confidence released by the Conference Board captures the level of confidence that individuals have in economic activity. A high level of consumer confidence stimulates economic expansion while a low level drives to economic downturn. Generally, a high reading is also positive for the USD, while a low reading is negative. Today's release revised last months figure from 68.1 to 69 and gave a figure of 76.2 against an anticipated 70 and dollar strength increased because of this and moved the EUR/USD to todays low of 1.28517, from a high of 1.29490. At the time of writing the pair has risen slightly to 1.28691. The hourly chart (below right) shows the intraday movements in more detail.
US Consumer Confidence rose to 76.2 against an expected 70. Aprils figure was revised up 0.9 points to 69 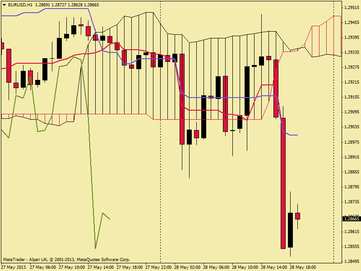 In todays trading I was happily short from 1.29438 and profited from today's release.
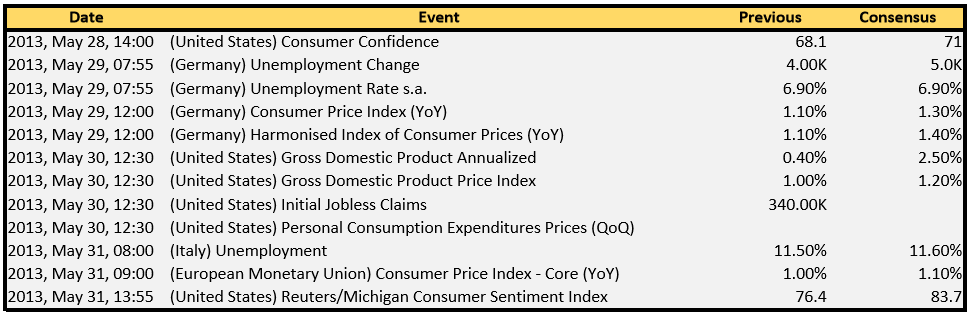
Tomorrow sees a burst of high impact data releases from Germany in respect of unemployment and CPI.
See my economic calendar below for more info. Needless to say, worse than expected data will be a further bearish driver which could eliminate any gains the pair makes overnight during the Asian session.
Better than expected data, however, could push price higher to test the daily tankan sen, currently at 1.3000.
Whilst still being bearish on the pair now is not the time to be placing further shorts ahead of this data.
Should I decide to trade tomorrows releases it will be with a lesser risk and I may adopt straddle entries in order to capture an either/or trade in the resulting direction which currently is a little unpredictable and volatile.
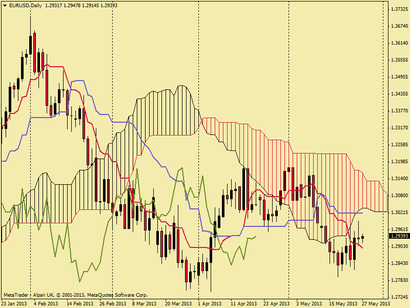 The chart to the left shows daily EUR/USD price action. As you can see, the theme has been somewhat bearish, and continues to be so as price remains beneath the cloud.
In recent weeks there have been recoveries back to the 1.30 zone but overall price has failed to breach the cloud to the other side.
Until price attacks the cloud base again, I'm going to remain bearish on this pair.
".... a fundamentally bearish outlook as dollar strength has yet to be pacified, only extremely good news from the Eurozone will manage to dent the advances of the greenback ... " 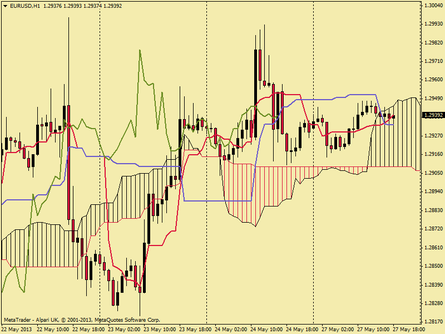 The hourly chart to the right shows the battles that have been fought as the pair has attempted recovery.
Again I reiterate that the bulls are only here for the short term and I anticipate shorting once price breaches the cloud base (1.29067) again.
My trading style and strategy is very short term and essentially relies on a 5 five minute kijun sen crossing an hourly kijun sen in the direction of the bias set by the daily and hourly charts.
Its a moving average crossover - with ichimoku flavouring, one that I believe presents high probability set ups in trending markets.
Hey everyone and apologies for not updating for so long, been kinda busy but I have not taken my eye off the ball completely. Since my GBP/JPY trade price has continued to rise hitting a new ceiling in the 144 region. I didn't buy off the tenkan sen bounce as, in my view, the price seemed too far from the tenkan sen and kijun sen at the time of analysis. Looking at the weekly chart it does certainly seem that there is a gap that needs to be filled. I guess I was just frightened of being at the wrong end of the gap at the wrong time but on the upside, I may have missed out on some short term gain but have not lost any capital..... In the meantime, I have been busy analysising Daily charts and nothing that I have seen has been strong enough to meet all the criteria required for entry. However trade withdrawal has set in a bit and I have found myself trading off the 5min with some degree of success. In the week gone by I placed 11 trades on the EUR/USD, 10 of which were winners and netted myself 516 pips, and subsequently increasing my account size by 21% so all good news on that front. I normally use the standard Ichimoku trading plan as described in "Trading with Ichimoku Clouds" by Manesh Patel, CTA. http://www.amazon.co.uk/Trading-Ichimoku-Clouds-Essential-Technical/dp/0470609931 but this week on 5 min charts I have been buying and selling off tenkan sen / kijun sen crosses, risking only 5% of the account each time and looking for a 2:1 at least, although a couple of the trades took a nasty turn so I used a trailing stop and achieved somewhere between 1:1 and 2:1. If you have not done so already, check out this facebook group, "Magic Ichimoku" http://www.facebook.com/groups/259239940783384/. Theres some useful info there and the regular commentary from contributors is informative and friendly. In fact one member Gerald Lian posted a comment relating to a EUR/GBP breakout on the 30m chart. Definately some gains to have been had there had I had more time to devote to trading this week. In addition to the above book, I would further recommend "Your Trading Psychology" by Kofi Oppong, I read it this week and whilst the content mostly reaffirmed some existing knowledge it was still an interesting and imformative read! Thats all for now happy trading!
My twitter followers will know already that my trade on this pair hit its stop and closed out for a profit of 3,829 pips last night. Typical that it was soon after I see that price purely bounced from this area back upwards, had my stop been lower I would still be in this trade, but, thats just the greed emotion doing it's thing as we know that we must have a stop somewhere.
Anyhow, this is the part where I summarise the trade and see where I could have done better. Remember, post trade analysis is crucial as it reveals how well you followed your trading plan, and how well your trading plan is performing and often highlights any areas for improvement.
STATS VALUE
Entry Date 17 December, 2012
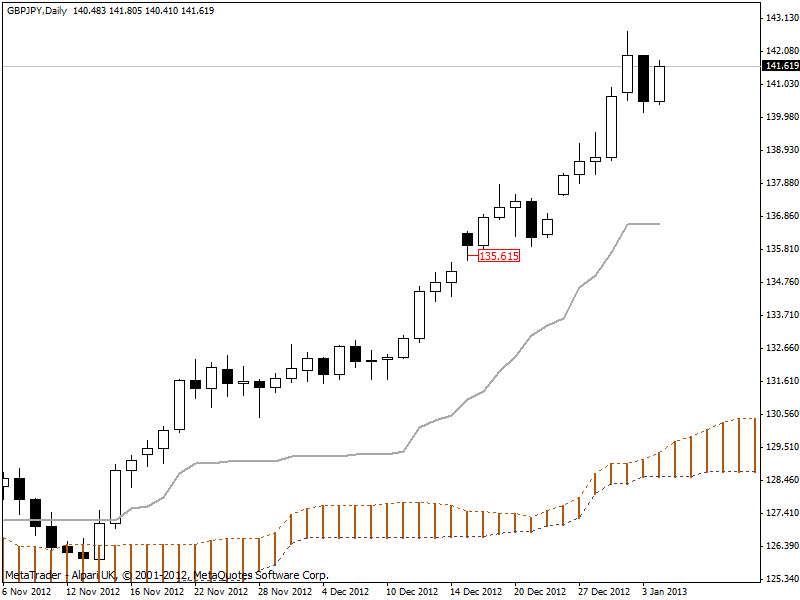
Entry Price 135.615
Entry Stop 134.750
Entry Risk 865 pips
Exit Date 8 January, 2013
Exit Price 139.444
Profit 3,829 pips
Max Profit 7,108 pips
Max Drawdown (135.615 - 135.426) = 189
Risk / Reward 0.22
COMMENTS
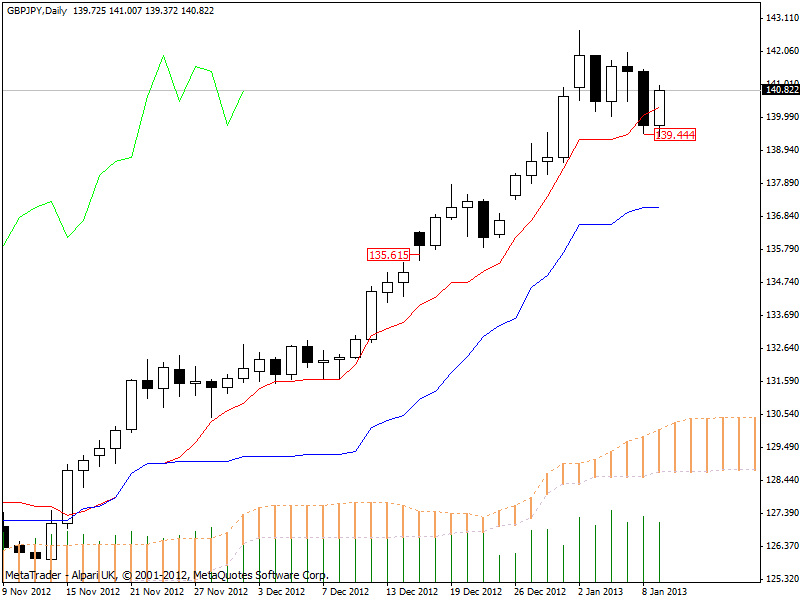
I took 54% of the maximum available profit, which is good because this strategy is designed to take around 40% because it is is a high probability trading strategy. On reflection, it is worth noting that on the 2nd January the tenkan sen began to flatten and price at that point was further than 2,000 pips away. This could have served as an exit signal and is infact one of the things listed in my money management plan to look out for. REMEMBER: Look at your plan DAILY, and ask yourself "are you following the plan?". I clearly was not and had I sold at close on the 2nd I would have walked away with 89% of the available profit! So, on a technical level, this trade was all very nicely implemented but on a management level, I could have done better and achieved outstanding, instead of above average, results.
We live and learn and the markets teach us accordingly!
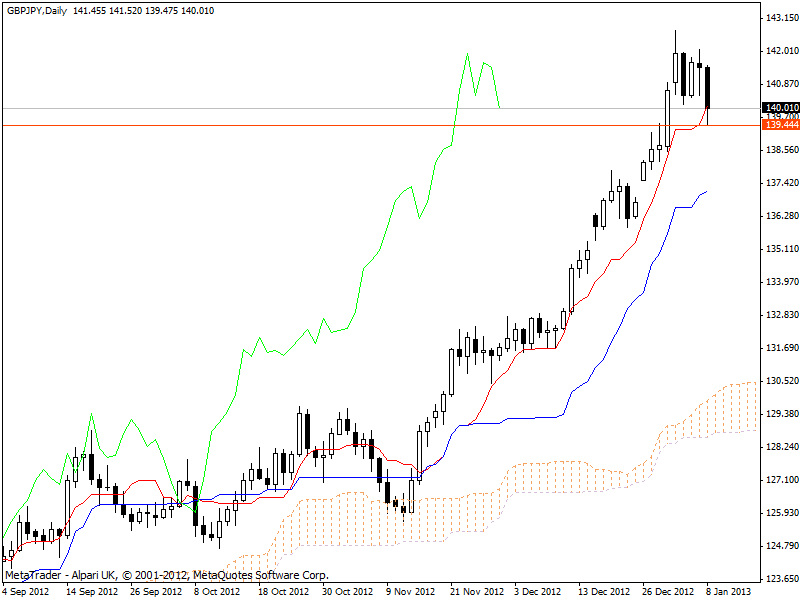
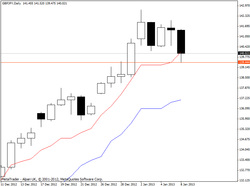 For today, a bearish candle, a lesson on the Tenkan Sen and a thank you....
Today my gains took a bit of a battering as bears pushed price action further down. Remember yesterday I set my stop to the closing tenkan sen of 139.444? Well todays low got pretty close to it at 139.475. This shows just how important the Tenkan Sen is as a short term support and resistance value. My trade is still alive, but only just.
As Ichimoku traders will know, when price crosses the Tenkan Sen it is a major accomplishment because it has broken a major short term support/resistance value. During a trend, if price action crosses the Tenkan Sen it can indicate one of three different scenarios:
1. Minor Short-Term Pull Back: A minor short term pull back is where price crosses over the Tenkan Sen but never crosses over the Kijun Sen and later resumes on the path of the original trend and this usually happens when short term traders take profit. The long term traders continue to hold their current position.
2. Major Short-Term Pull Back: A major pull back will have price crossing both the Tenkan Sen and Kijun Sen in the opposite direction of the trend. Once it has done that, price eventually continues on the original path crossing them both again. In this scenario, long term position traders are taking some profits, They are not closing out their position at all because they believe the instrument will continue the trend after the major pull back has finished.
3. Countertrend: The third scenario is similar to the second scenario where price crosses over both the Tenkan Sen and the Kijun Sen. The crossover takes place in the opposite direction of the trend. However, the majoy trend never resumes. Either the instrument (currency pair in this case) enters a consolidation pattern (sideways) or a new trend forms. In this scenario, the long term traders are exiting their positions completely. They can do so over a certain time period or all at once in some cases.
Price currently has not fully crossed at a close but it may well happen. I would hope that price is just returning to equilibrium with the Tenkan Sen and at worst we are experiencing a minor short term pull back. I did predict a bounce from the 139.000 area so at this stage I am prepared for my stop to be hit soon as per my prediction and as well that it may be the Tenkan Sen value I used as my stop is not strong enough to support price action any further. Nonetheless I am still enjoying a highly profitable run from my 135.615 buy order. Price at the time of writing is 140.033 and I am looking forward to seeing what tomorrows candle brings.
Happy trading and as a foot note I would like to thank all visitors for thier support and interest, I have noted that views are increasing daily and a further thank you for the 400+ who have taken it once stage further and are now following me on twitter.
still profitable from a buy at 135.615 but cashing up time could come soon
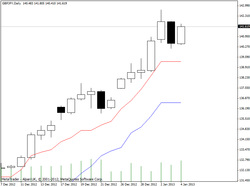
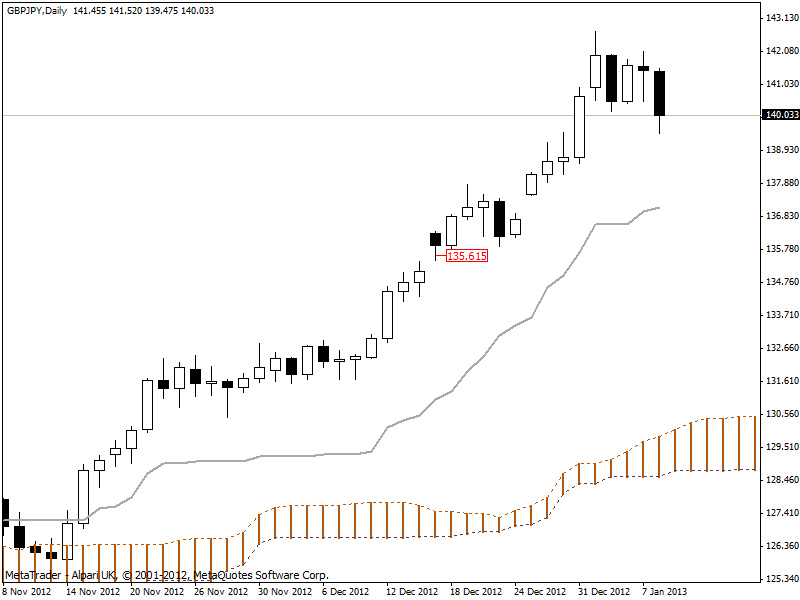
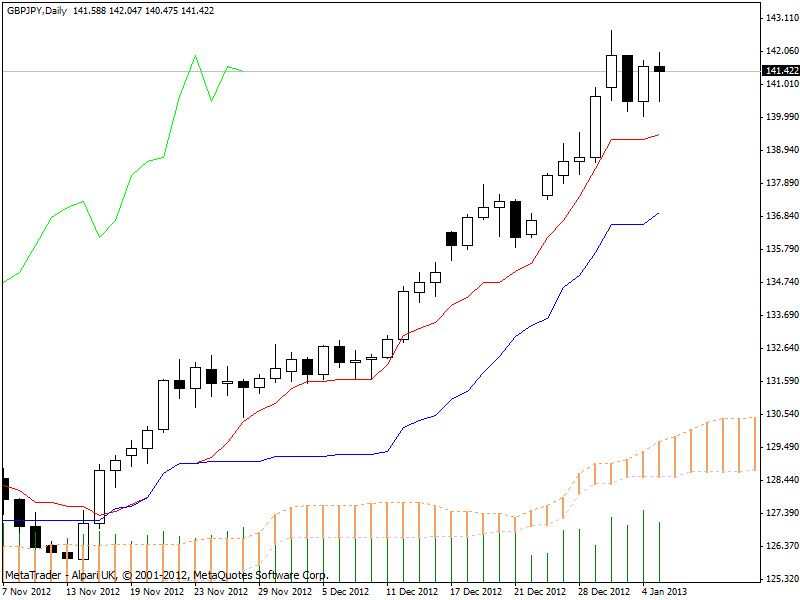
 Bears started the week no stronger than they left the last as no lower lows were reached today. The candlestick did close in the hammer shape but I'm not too concerned over this as there may be some signs of further bullish development.
Both the tenkan sen and the kijun sen have changed from being absolutely flat to raising thier angle slightly, behaviour also imitated by sekou span A which with senkou span B flat, signals a medium bullish signal.
With no further lows, and closing at 141.441 I am still bullish on the GBP/JPY.
The tenkan sen closed at 139.444 and I have move my stop to this level. From a buy order on 17 December 2012 at 135.615 our trade now sits at 5,826 pips.
Thats it for today, happy trading everyone!
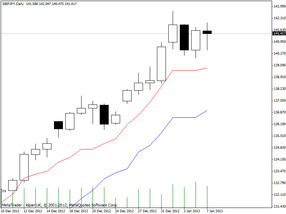
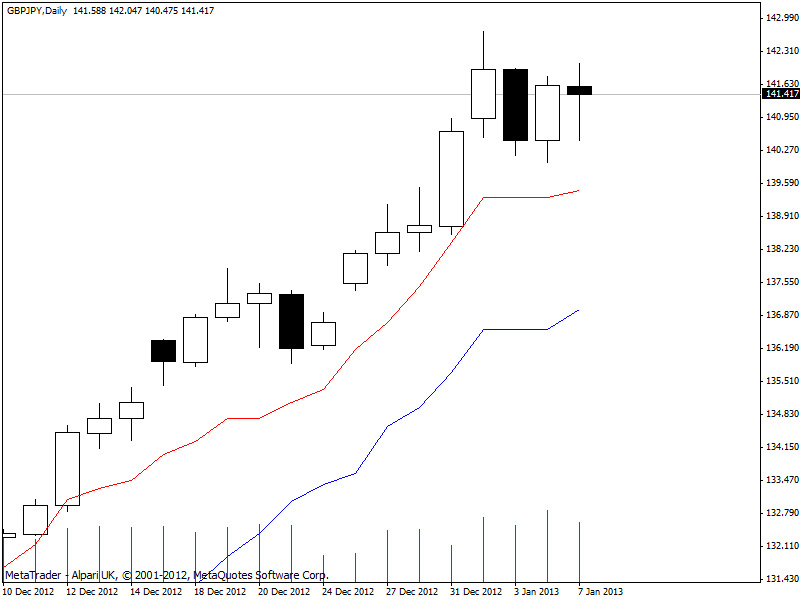
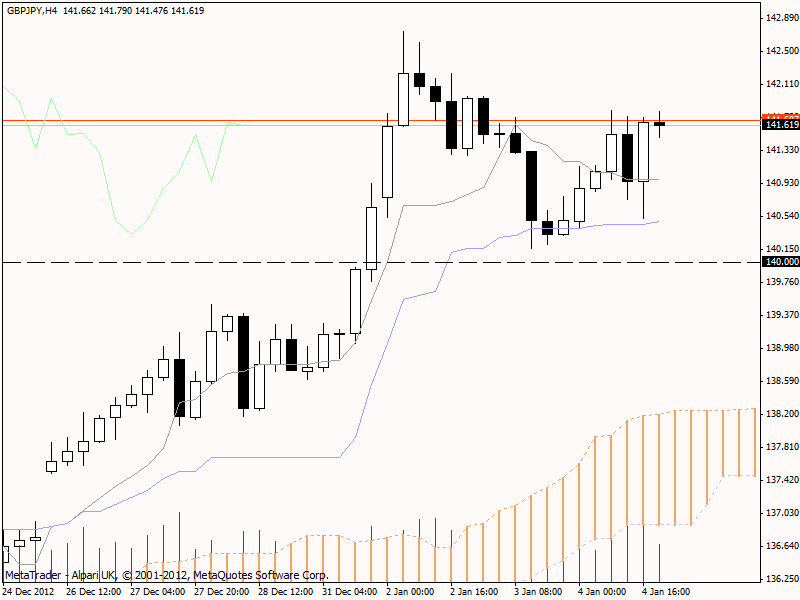
Friday saw buyers almost wipe out the gains of the previous days sellers by driving the price of the GBP/JPY from 140.494 to a high of 141.805 before settling to close for the week at 141.619.
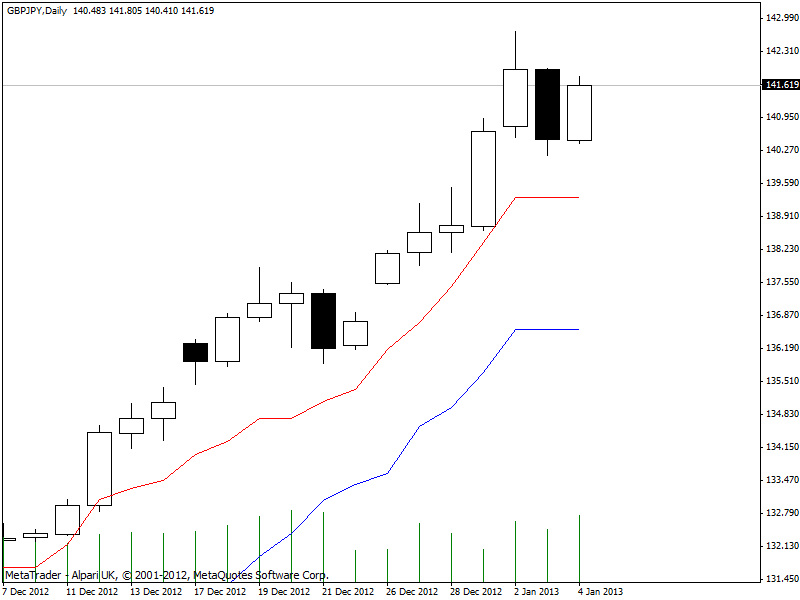
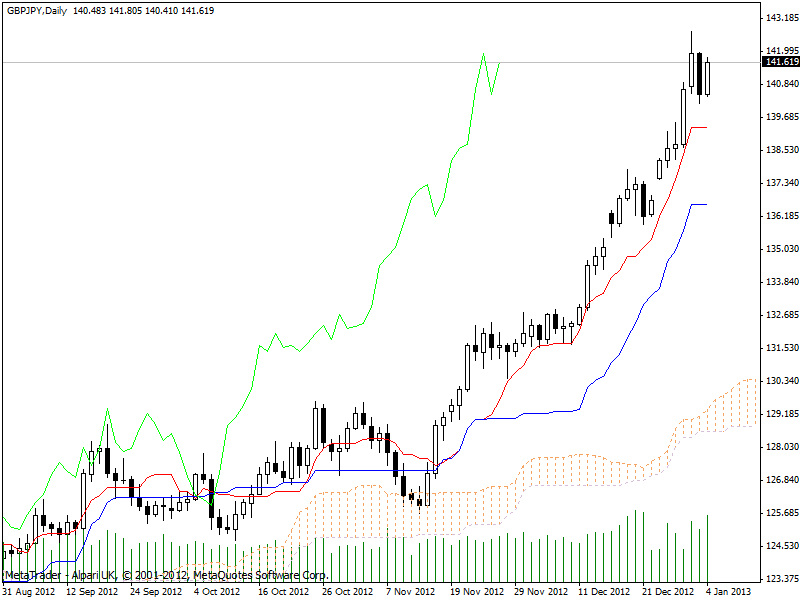
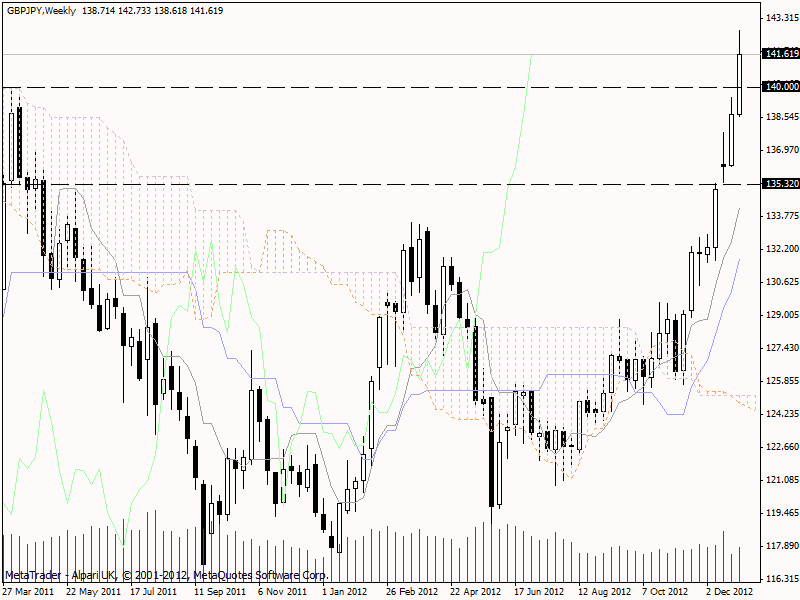
The daily and weekly charts below both continue to paint a bullish picture with the total weeks gain amounting to 2,905 pips (O:138.714, C:141.619). This move is slighty up from the previous weeks gains of 2,465 pips.
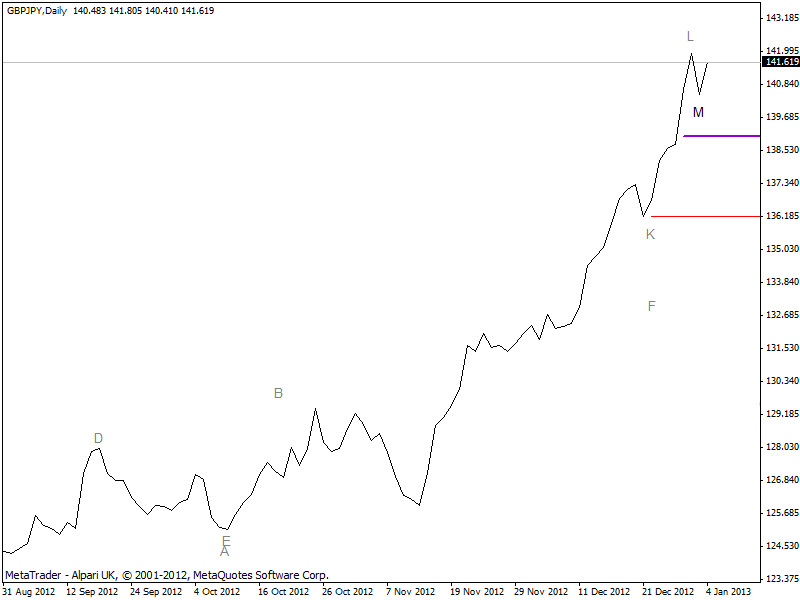
"The daily and weekly charts below both continue to paint a bullish picture" 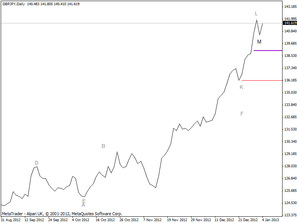 Buyers, such as I, will be happy to see a bullish close, and also the development of a higher low, marked by the bold "M" on the chart to the right. For profit protection measures I continue to hold my stop at 139.000. This is the level where I expected bears to push prices back to this week. The new higher low tells me that they have not had enough power to do this yet. If they do at all remains to bee seen and as always, I eagerly await the close of the next candle.
In the meantime I continue to be bullish on the GBP/JPY.
My current trade on this pair is, at yesterdays close, in profit to the tune of 6,004 pips from a buy order placed at 135.615 on 17 December 2012.
 One thing I didn't do this week, and its important to comment on failings, is to regulary check my next lowest time frame.
Here on the 4H chart to the left you can see price action being rejected by the kijun sen on thursday the 3rd , this bounce was effectively another buying opportunity and my faults are:
1. I wasn't looking for it and;
2. I didn't spot it on Thursday!
REMEMBER: ALWAYS CHECK YOUR NEXT LOWEST TIME FRAMES!!!
|


 RSS Feed