Hey everyone and apologies for not updating for so long, been kinda busy but I have not taken my eye off the ball completely. Since my GBP/JPY trade price has continued to rise hitting a new ceiling in the 144 region. I didn't buy off the tenkan sen bounce as, in my view, the price seemed too far from the tenkan sen and kijun sen at the time of analysis. Looking at the weekly chart it does certainly seem that there is a gap that needs to be filled. I guess I was just frightened of being at the wrong end of the gap at the wrong time but on the upside, I may have missed out on some short term gain but have not lost any capital..... In the meantime, I have been busy analysising Daily charts and nothing that I have seen has been strong enough to meet all the criteria required for entry. However trade withdrawal has set in a bit and I have found myself trading off the 5min with some degree of success. In the week gone by I placed 11 trades on the EUR/USD, 10 of which were winners and netted myself 516 pips, and subsequently increasing my account size by 21% so all good news on that front. I normally use the standard Ichimoku trading plan as described in "Trading with Ichimoku Clouds" by Manesh Patel, CTA. http://www.amazon.co.uk/Trading-Ichimoku-Clouds-Essential-Technical/dp/0470609931 but this week on 5 min charts I have been buying and selling off tenkan sen / kijun sen crosses, risking only 5% of the account each time and looking for a 2:1 at least, although a couple of the trades took a nasty turn so I used a trailing stop and achieved somewhere between 1:1 and 2:1. If you have not done so already, check out this facebook group, "Magic Ichimoku" http://www.facebook.com/groups/259239940783384/. Theres some useful info there and the regular commentary from contributors is informative and friendly. In fact one member Gerald Lian posted a comment relating to a EUR/GBP breakout on the 30m chart. Definately some gains to have been had there had I had more time to devote to trading this week. In addition to the above book, I would further recommend "Your Trading Psychology" by Kofi Oppong, I read it this week and whilst the content mostly reaffirmed some existing knowledge it was still an interesting and imformative read! Thats all for now happy trading!
My twitter followers will know already that my trade on this pair hit its stop and closed out for a profit of 3,829 pips last night. Typical that it was soon after I see that price purely bounced from this area back upwards, had my stop been lower I would still be in this trade, but, thats just the greed emotion doing it's thing as we know that we must have a stop somewhere.
Anyhow, this is the part where I summarise the trade and see where I could have done better. Remember, post trade analysis is crucial as it reveals how well you followed your trading plan, and how well your trading plan is performing and often highlights any areas for improvement.
STATS VALUE
Entry Date 17 December, 2012
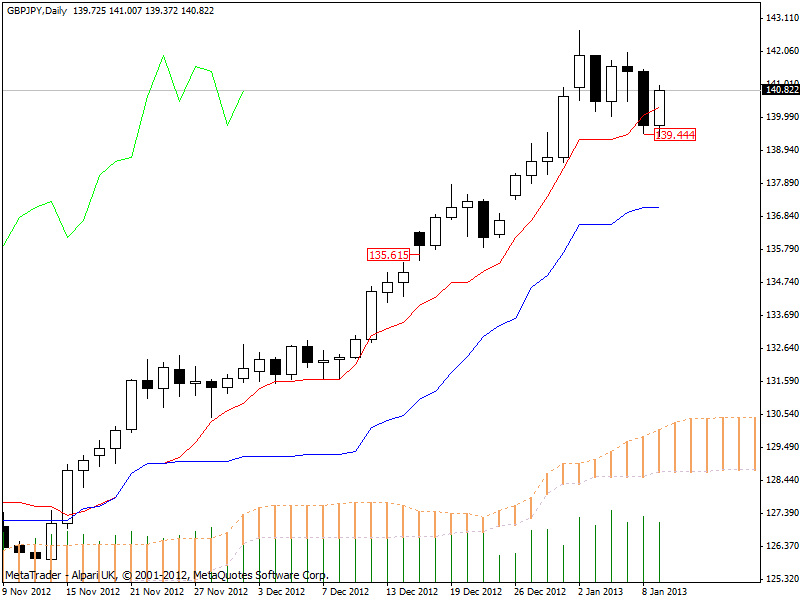
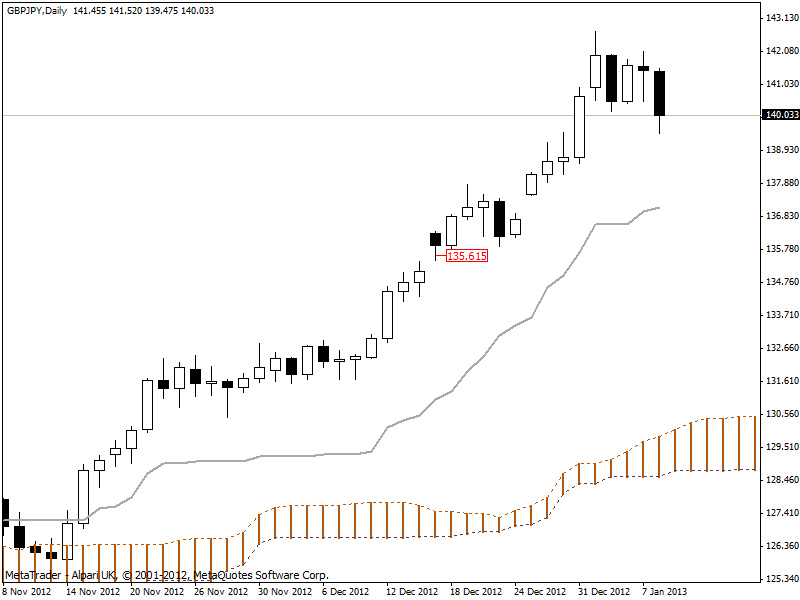
Entry Price 135.615
Entry Stop 134.750
Entry Risk 865 pips
Exit Date 8 January, 2013
Exit Price 139.444
Profit 3,829 pips
Max Profit 7,108 pips
Max Drawdown (135.615 - 135.426) = 189
Risk / Reward 0.22
COMMENTS
I took 54% of the maximum available profit, which is good because this strategy is designed to take around 40% because it is is a high probability trading strategy. On reflection, it is worth noting that on the 2nd January the tenkan sen began to flatten and price at that point was further than 2,000 pips away. This could have served as an exit signal and is infact one of the things listed in my money management plan to look out for. REMEMBER: Look at your plan DAILY, and ask yourself "are you following the plan?". I clearly was not and had I sold at close on the 2nd I would have walked away with 89% of the available profit! So, on a technical level, this trade was all very nicely implemented but on a management level, I could have done better and achieved outstanding, instead of above average, results.
We live and learn and the markets teach us accordingly!
 For today, a bearish candle, a lesson on the Tenkan Sen and a thank you....
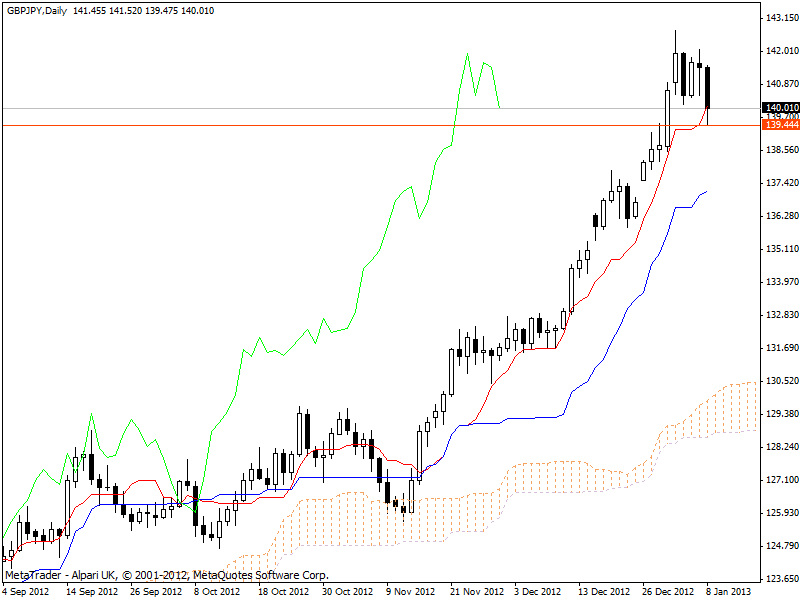
Today my gains took a bit of a battering as bears pushed price action further down. Remember yesterday I set my stop to the closing tenkan sen of 139.444? Well todays low got pretty close to it at 139.475. This shows just how important the Tenkan Sen is as a short term support and resistance value. My trade is still alive, but only just.
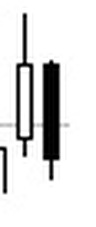
As Ichimoku traders will know, when price crosses the Tenkan Sen it is a major accomplishment because it has broken a major short term support/resistance value. During a trend, if price action crosses the Tenkan Sen it can indicate one of three different scenarios:
1. Minor Short-Term Pull Back: A minor short term pull back is where price crosses over the Tenkan Sen but never crosses over the Kijun Sen and later resumes on the path of the original trend and this usually happens when short term traders take profit. The long term traders continue to hold their current position.
2. Major Short-Term Pull Back: A major pull back will have price crossing both the Tenkan Sen and Kijun Sen in the opposite direction of the trend. Once it has done that, price eventually continues on the original path crossing them both again. In this scenario, long term position traders are taking some profits, They are not closing out their position at all because they believe the instrument will continue the trend after the major pull back has finished.
3. Countertrend: The third scenario is similar to the second scenario where price crosses over both the Tenkan Sen and the Kijun Sen. The crossover takes place in the opposite direction of the trend. However, the majoy trend never resumes. Either the instrument (currency pair in this case) enters a consolidation pattern (sideways) or a new trend forms. In this scenario, the long term traders are exiting their positions completely. They can do so over a certain time period or all at once in some cases.
Price currently has not fully crossed at a close but it may well happen. I would hope that price is just returning to equilibrium with the Tenkan Sen and at worst we are experiencing a minor short term pull back. I did predict a bounce from the 139.000 area so at this stage I am prepared for my stop to be hit soon as per my prediction and as well that it may be the Tenkan Sen value I used as my stop is not strong enough to support price action any further. Nonetheless I am still enjoying a highly profitable run from my 135.615 buy order. Price at the time of writing is 140.033 and I am looking forward to seeing what tomorrows candle brings.
Happy trading and as a foot note I would like to thank all visitors for thier support and interest, I have noted that views are increasing daily and a further thank you for the 400+ who have taken it once stage further and are now following me on twitter.
still profitable from a buy at 135.615 but cashing up time could come soon
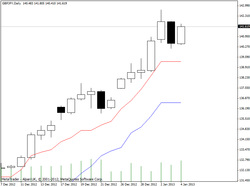
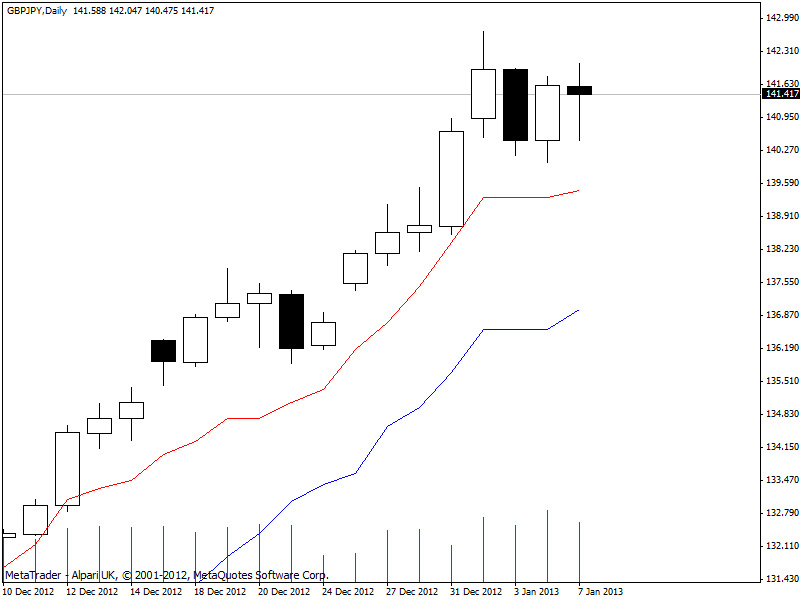
 Bears started the week no stronger than they left the last as no lower lows were reached today. The candlestick did close in the hammer shape but I'm not too concerned over this as there may be some signs of further bullish development.
Both the tenkan sen and the kijun sen have changed from being absolutely flat to raising thier angle slightly, behaviour also imitated by sekou span A which with senkou span B flat, signals a medium bullish signal.
With no further lows, and closing at 141.441 I am still bullish on the GBP/JPY.
The tenkan sen closed at 139.444 and I have move my stop to this level. From a buy order on 17 December 2012 at 135.615 our trade now sits at 5,826 pips.
Thats it for today, happy trading everyone!
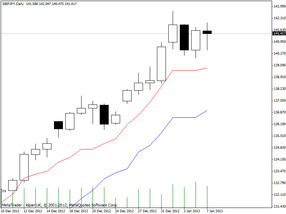
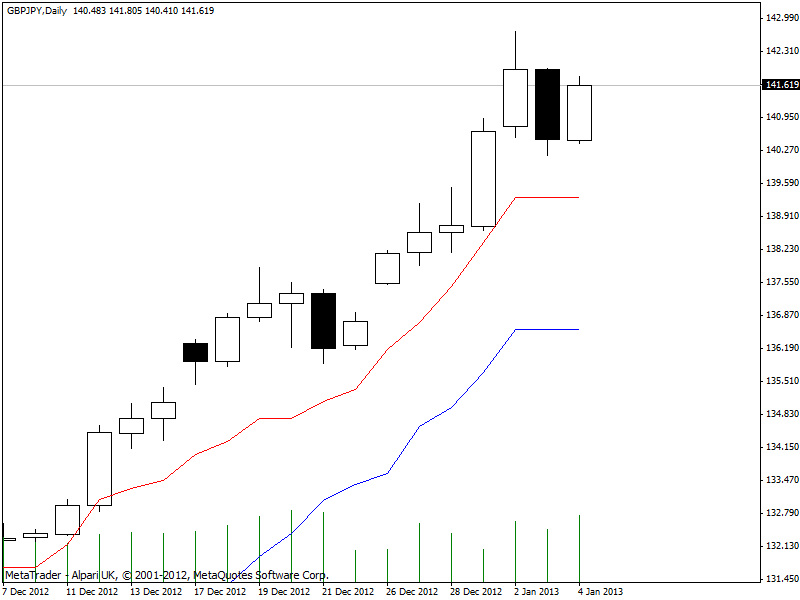
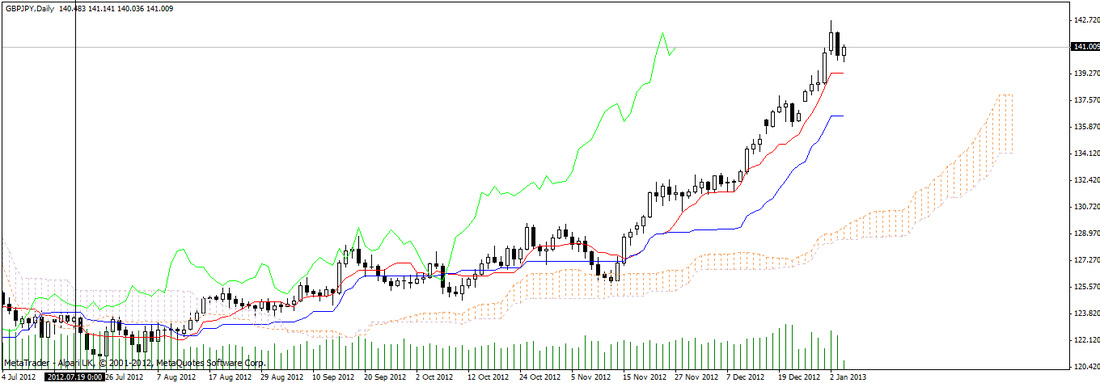
Friday saw buyers almost wipe out the gains of the previous days sellers by driving the price of the GBP/JPY from 140.494 to a high of 141.805 before settling to close for the week at 141.619.
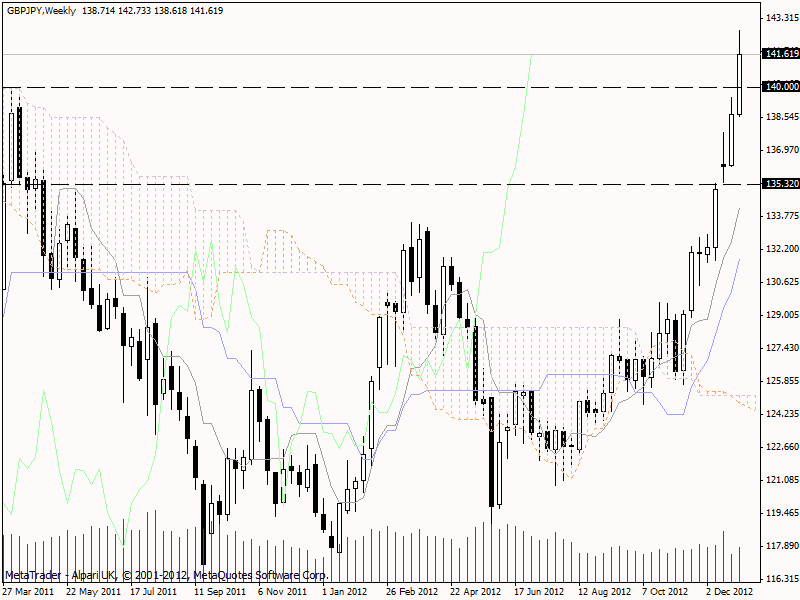
The daily and weekly charts below both continue to paint a bullish picture with the total weeks gain amounting to 2,905 pips (O:138.714, C:141.619). This move is slighty up from the previous weeks gains of 2,465 pips.
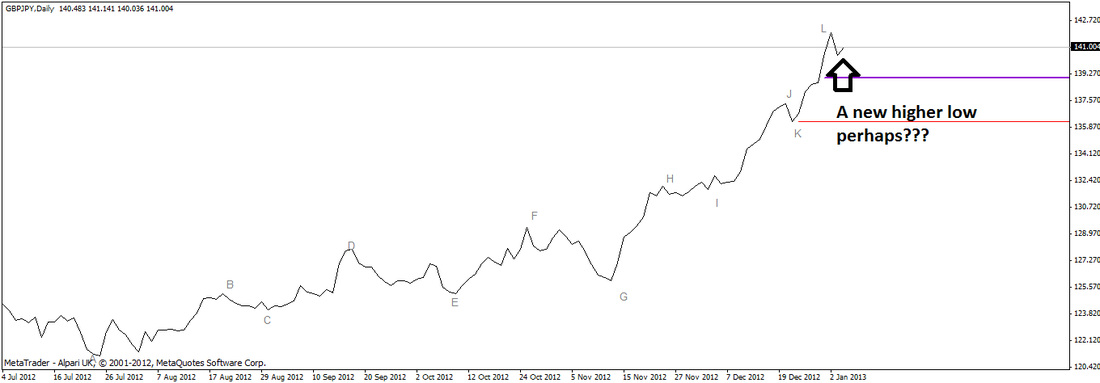
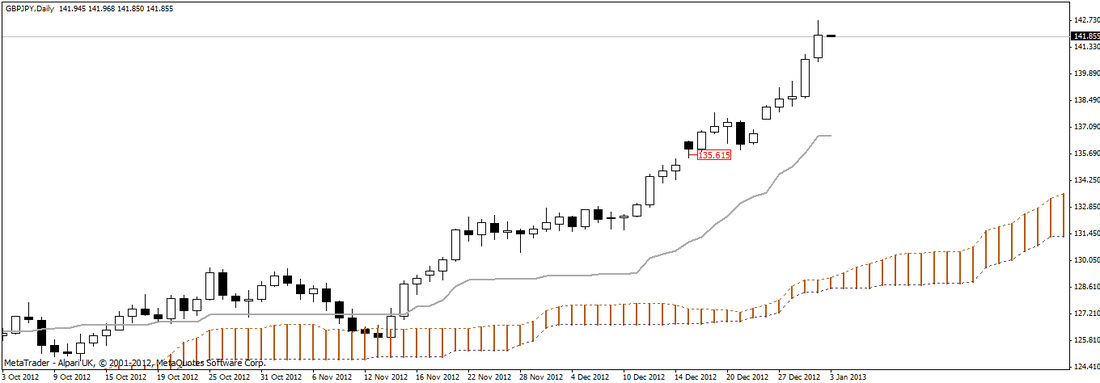
"The daily and weekly charts below both continue to paint a bullish picture" 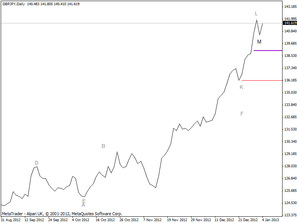 Buyers, such as I, will be happy to see a bullish close, and also the development of a higher low, marked by the bold "M" on the chart to the right. For profit protection measures I continue to hold my stop at 139.000. This is the level where I expected bears to push prices back to this week. The new higher low tells me that they have not had enough power to do this yet. If they do at all remains to bee seen and as always, I eagerly await the close of the next candle.
In the meantime I continue to be bullish on the GBP/JPY.
My current trade on this pair is, at yesterdays close, in profit to the tune of 6,004 pips from a buy order placed at 135.615 on 17 December 2012.
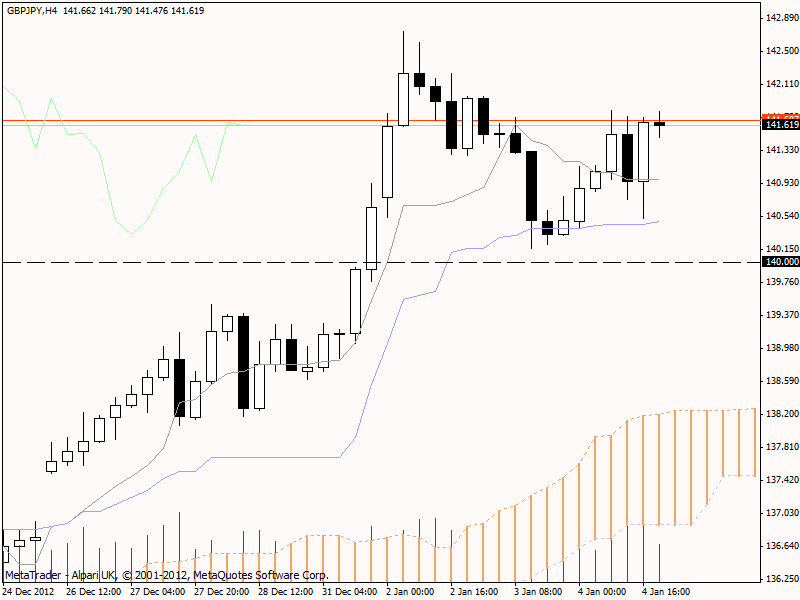
 One thing I didn't do this week, and its important to comment on failings, is to regulary check my next lowest time frame.
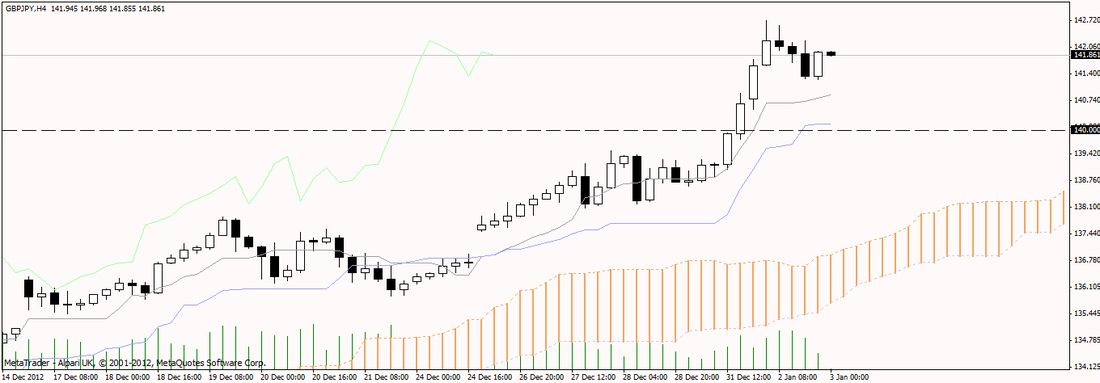
Here on the 4H chart to the left you can see price action being rejected by the kijun sen on thursday the 3rd , this bounce was effectively another buying opportunity and my faults are:
1. I wasn't looking for it and;
2. I didn't spot it on Thursday!
REMEMBER: ALWAYS CHECK YOUR NEXT LOWEST TIME FRAMES!!!
 Yesterday I anticipated a bearish candle and lo and behold here we have a
bearish engulfing candle that saw a low of 140.163 before closing slightly
higher at 140.494. I also commented yesterday that I expected the pull back to
hit 139.000 at worst, and this is also where I decided to place my stop.
If fortune is in my favour, the 140.494 close will be another higher low and we will see further bullish activity, the bears have not made their mark on the charts and therefore not convinced me yet. All charts are still firmly in bullish territory but I look forward to the close of the next candle for more detail.
On a close of 140.494, I am 4,879 pips up from my buy at 135.615 and remain bullish on the GBP/JPY.
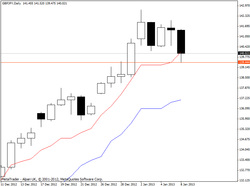
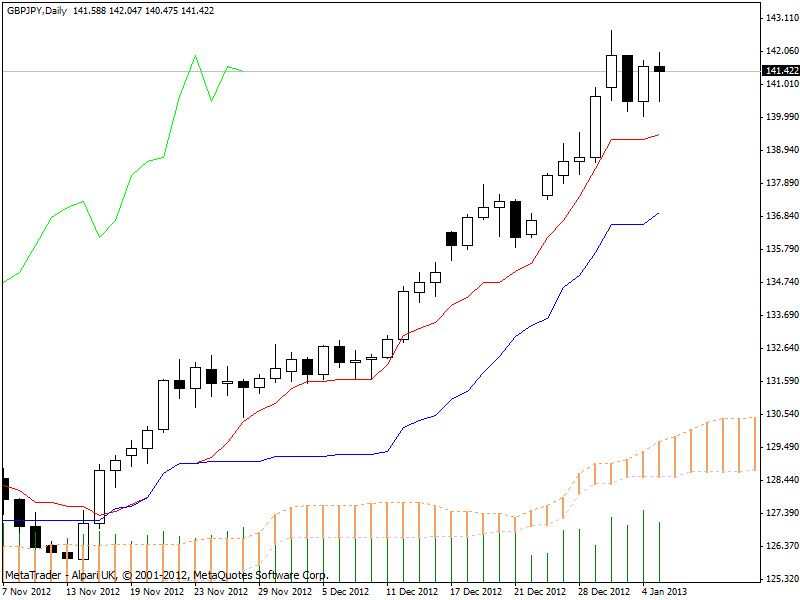
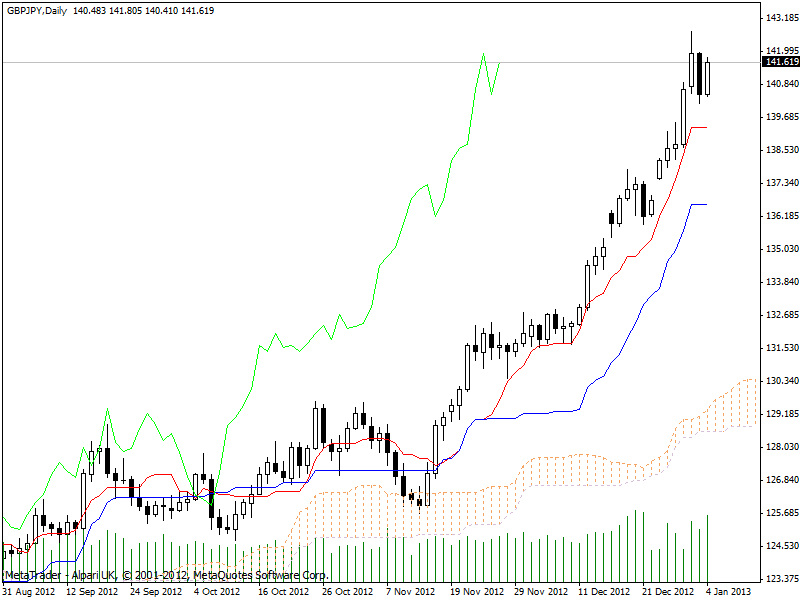
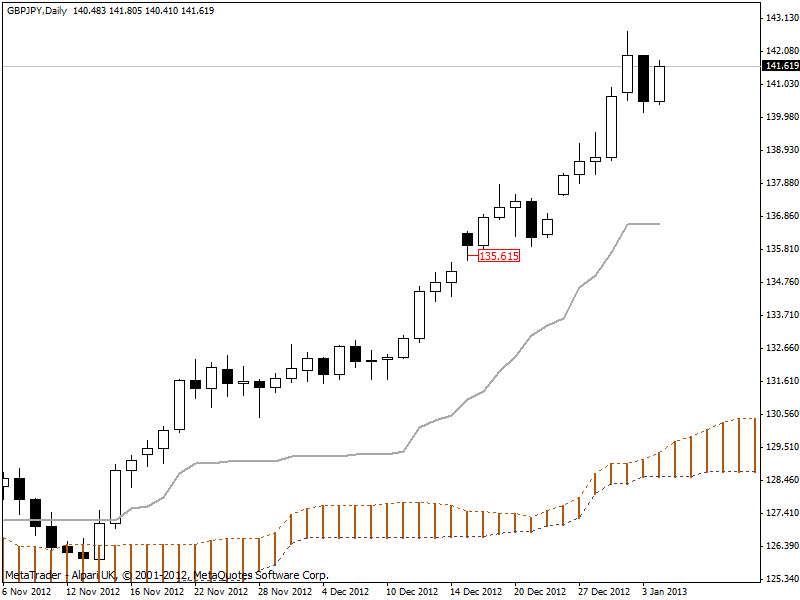
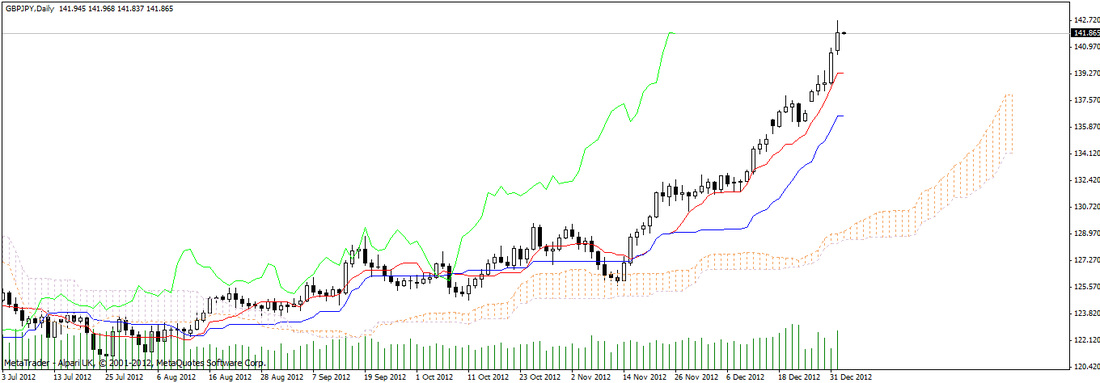
 Happy New Year! In the first few days of 2013 trading the Yen continued to fall sharply against the Pound obliterating levels unchartered since 2011 and is now threatening 145.000, a level not seen since 25 April 2010.
Over the last couple of days the GBP/JPY has reached highs of 140.934 and 142.773 respectively before settling to close at 141.947.
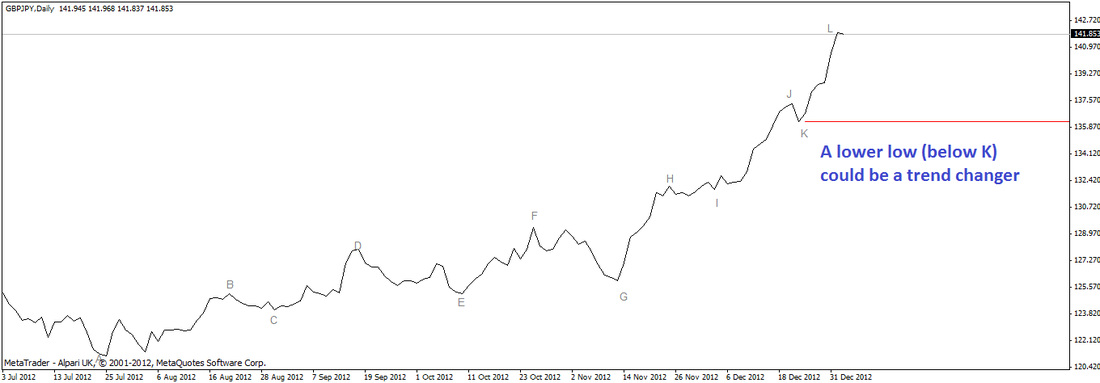
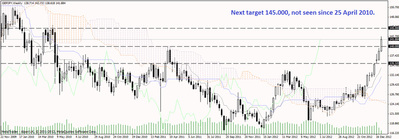 The daily ichimoku chart above, the weekly chart to the right and the four hour chart clearly show the currency pair as bullish with all signs seemingly pointing to the sky as price action is way above the kumo, comtinuing to make higher highs and higher lows as illustrated further below.
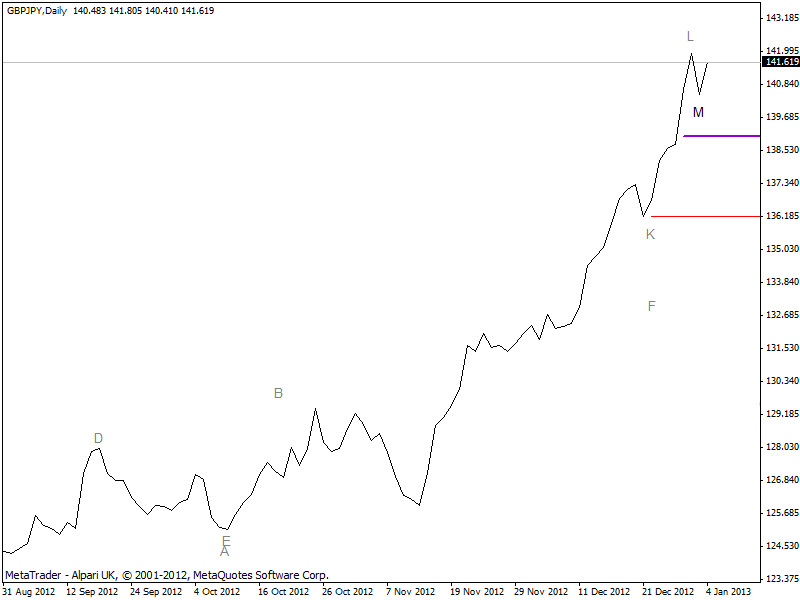
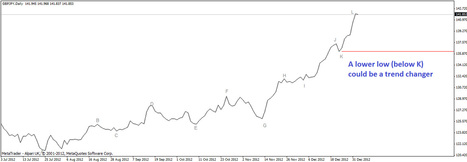 I am, of course, expecting some pull back at the worst to 139.000, and it would need bear power creating a lower low below my K marking, (approx. 136.200), tp be a trend changer for me personally.
In summary, I am still very much bullish on this pair as the uptrend is by my interpretation, intact for now. At the time of writing the pair is at 141.934. As any regular readers will know, I entered my trade at 135.615 and am therefore currently profitable to the tune of 6,319 pips. Part of me is screaming to end this trade and take profit but a trend is a trend and it was never my intention at the outset to ride the trend to the top. As we know, we can only define a top or a bottom retrospectively and this is written on a post-it note on all my screens at present to remind me of this important lesson.
That said, my stop has now moved up to 139.000 mark as of tonight to protect the majority of profits and this is no bad thing. Until next time, happy trading!
On another note, a reader requested that I implement a click to enlarge feature on all pictures I post here. This has now been done!
|


 RSS Feed