To recap, on 17th December I entered a long trade on the GBP/JPY at 135.615. This shortened week over the xmas period saw further bullish development as anticipated:
24th December saw the pair recover and close to 136.744 leaving us with a bullish Harami pattern, denoting further upwards extention for this pair.
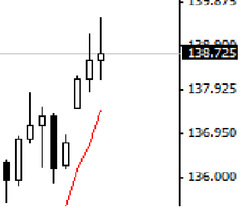
26th December saw significant gains and new highs closing at 138.159 leaving a nice bullish candle. Gains were extended futher on the 27th and 28th reaching highs of 139.508 before closing at 138.725.
The end of the week draws and I am still in profit to the tune of 3,110 pips (138.725 - 135.615) at approx 4 GBP per pip.
The candle on the 28th is almost a Doji and shows a lot of bearish pressure. Reaction and analysis in general from "the herd" (twitter, forexpros etc) is that 140.000 will present a challange and sellers are already gearing up to attempt to pick a top and make gains on the way down.
On a weekly Ichimoku chart one can see that the pair has not reached these levels since April 2011 and that the scene is clearly bullish. However, on the monthly ichimoku chart the scene is long term bearish still but a bullish tenkan-sen/kijun-sen cross has occurred as and this is generally considered to be a weak signal when occuring beneath the cloud. My (perhaps contrarian) view is that this weak signal may well be weak for the monthly time frame but perhaps not for the weekly and dailys, as is confirmed in my mind from the analysis of those particular charts. I am cautious of the 140.00 but this has been tested once before and it is often the case that a second test fairs better. Nay-sayers are quick to forecast the demise of the pound yen and I do expect to see some bearish volume over the coming week.
To protect my gains I am moving my stop to 137.500 but I remain bullish on the pair awaiting the close of the next candle.
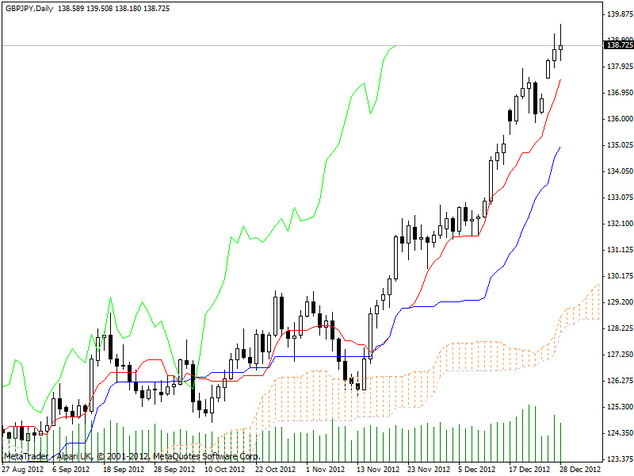
Daily Ichimoku Chart: GBP/JPY
 RSS Feed