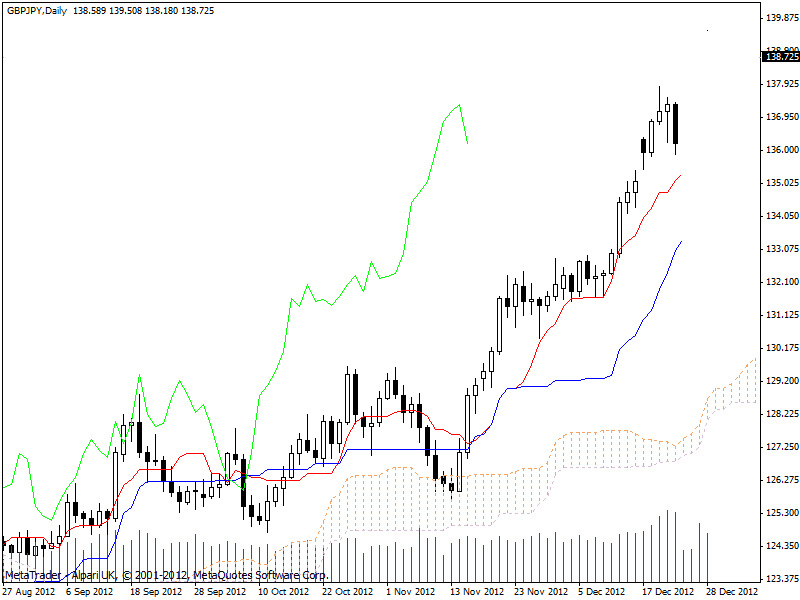
A lot has happened since the 17th December where I went long on a bounce off the 135/6 area at 135.615 with a target view of taking profit at the 136.300 resistance.
17th December saw a bullish rise to a high of 136.770 before dipping to its close of 135.927. Although my target profit had been achieved I did not take profit but instead decided to see what the next candle would reveal. Bearing in mind the bullish picture of the daily Icimoku chart and the index analysis conducted previously I believed there could be much further on the upside, perhaps even a test of my next resistance level of 137.600.
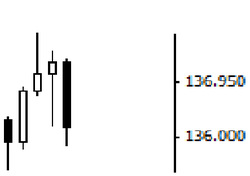
18th December revealed a bullish engulfing pattern fueling my decision to remain in the trade. The pair hit a high of 136.913 before closing at 136.831.
19th December saw the pair reach new highs of 137.860, breaching the next level of resistance refered to above. The candle closed as a shooting star, denoting potential for reversal. Other than this one indication as all other signs are bullish, I again awaited the next candle.
20th December revealed a bearish hanging man and a low of 136.217. I considered the dow theory that a lower low would need to appear before this showed a reversal in the trend and plotted the chart below. All lows to this point have been higher lows and point to an uptrend, as does the Ichimoku chart.
21st December revealed a bearish engulfing almost bearish marabozu candle hitting a low of 135.886 before closing at 136.196. I interpret this move as a return to the trendline and not a sign of overall bearishness, remember that Ichimoku is bullish and overall the pound is doing very well against the yen.
And so the week ends with some gains wiped but in profit to the tune of 581 (136.196-135.615) at approx 4 GBP to the pip. Risk was initially 5% of captial but stop loss has been moved to break even to protect against bearish development. Happy to be in a risk free and insofar profitable trade.
My outlook remains bullish on the GBP/JPY.
 RSS Feed